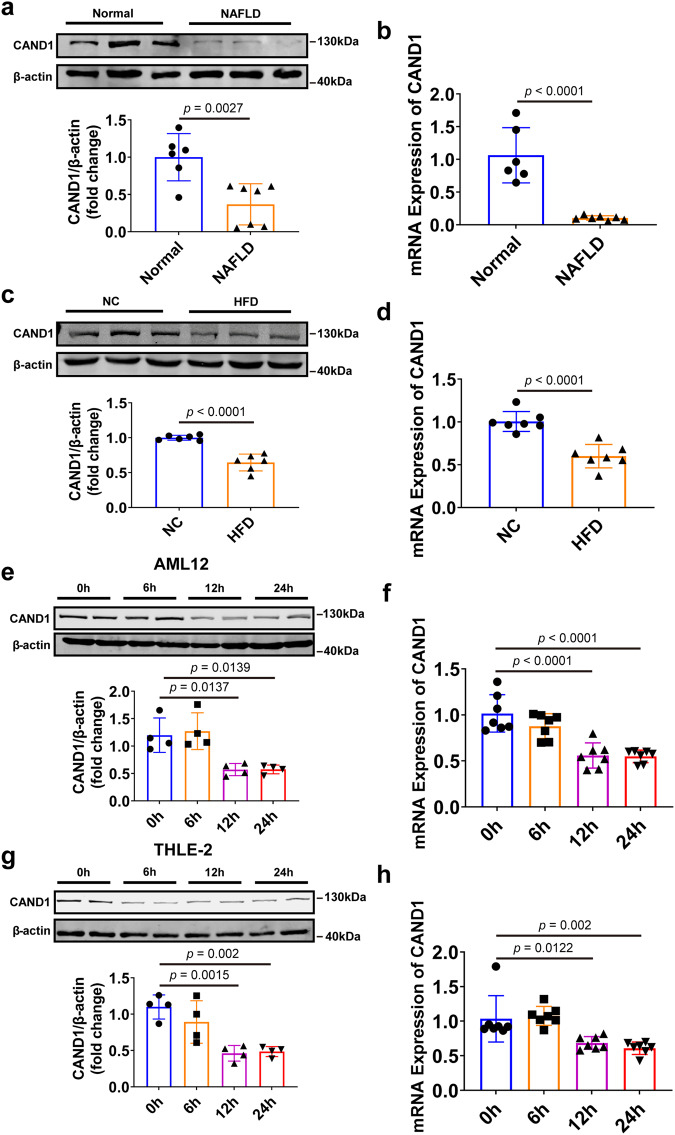
Fig. 1. CAND1 expression is decreased in the liver during hepatic steatosis.
a Western blotting of CAND1 in liver samples from normal donors (n = 6) and NAFLD patients (n = 7). b CAND1 mRNA level in liver samples from normal donors (n = 6) and NAFLD patients (n = 7). c Western blotting of CAND1 in the livers from HFD-fed and NC-fed mice (n = 6). NC, Normal chow. d The mRNA levels of CAND1 in the livers from HFD-fed and NC-fed mice (n = 7). e Western blotting of CAND1 in AML12 cells treated with PA (n = 4). f CAND1 mRNA level in AML12 cells treated with PA (n = 7). g Western blotting of CAND1 in THLE-2 cells treated with PA (n = 4). h CAND1 mRNA level in THLE-2 cells treated with PA (n = 7). p values obtained via two-tailed unpaired Student’s t tests, one-way ANOVA with Tukey’s multiple comparisons test. The data were shown as means ± SD of independent biological replicates. Source data are provided as a Source data file.

