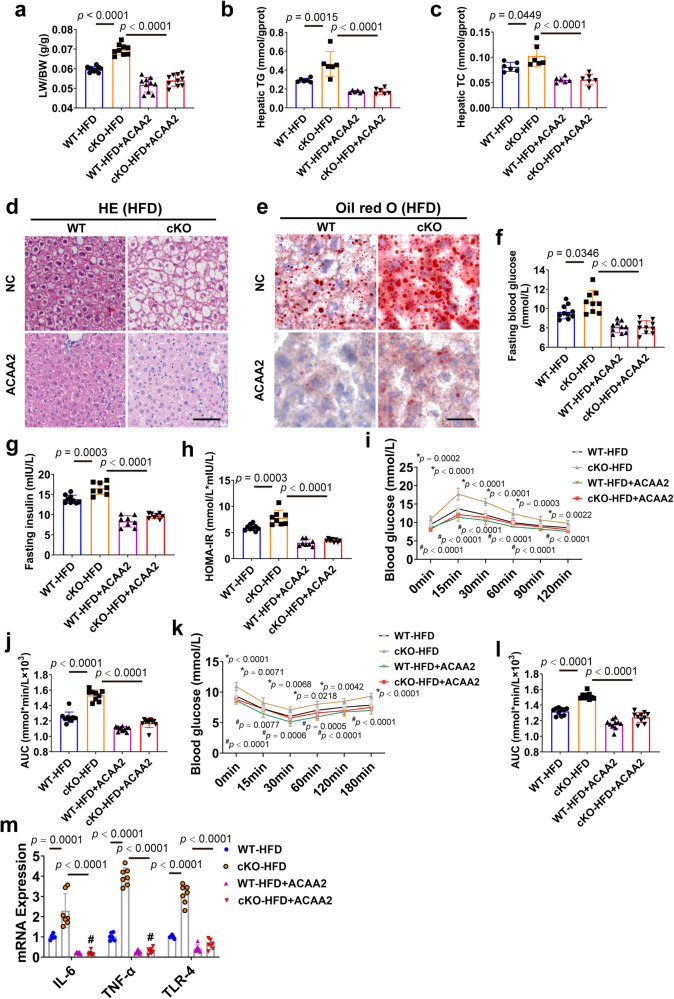
Fig. 6. ACAA2 overexpression ameliorates CAND1 deficiency-potentiated hepatic steatosis, insulin resistance and inflammation in male mice.
a LW/BW ratio in the indicated groups after 16 weeks of HFD feeding (WT-HFD, n = 10; cKO-HFD, n = 9; WT-HFD + ACAA2, n = 10; cKO-HFD + ACAA2, n = 10). b, c TG and TC content in the indicated group after 16 weeks of HFD feeding (n = 6). d H&E staining of liver sections in the indicated groups (n = 8). Scale bar = 50 μm. Magnification 200×. e Oil red O of liver sections staining (n = 8). Scale bar=50 μm. Magnification 200×. f Fasting blood glucose (WT-HFD, n = 10; cKO-HFD, n = 9; WT-HFD + ACAA2, n = 10; cKO-HFD + ACAA2, n = 10). g Fasting insulin levels (WT-HFD, n = 9; cKO-HFD, n = 8; WT-HFD + ACAA2, n = 8; cKO-HFD + ACAA2, n = 8). h HOMA-IR index (WT-HFD, n = 9; cKO-HFD, n = 8; WT-HFD + ACAA2, n = 8; cKO-HFD + ACAA2, n = 8). i GTTs (WT-HFD, n = 10; cKO-HFD, n = 9; WT-HFD + ACAA2, n = 10; cKO-HFD + ACAA2, n = 10). j AUC of GTT (WT-HFD, n = 10; cKO-HFD, n = 9; WT-HFD + ACAA2, n = 10; cKO-HFD + ACAA2, n = 10). k ITTs (WT-HFD, n = 10; cKO-HFD, n = 9; WT-HFD + ACAA2, n = 10; cKO-HFD + ACAA2, n = 10). l AUC of ITT (WT-HFD, n = 10; cKO-HFD, n = 9; WT-HFD + ACAA2, n = 10; cKO-HFD + ACAA2, n = 10). m mRNA levels of inflammatory cytokines in the livers of the indicate group after 16 weeks of HFD feeding (WT-HFD, n = 6; cKO-HFD, n = 7; WT-HFD + ACAA2, n = 7; cKO-HFD + ACAA2, n = 7). p values obtained via one-way ANOVA with Tukey’s multiple comparisons test. The data were shown as means ± SD of independent biological replicates. Source data are provided as a Source data file. LW/BW, liver weight/body weight. TG, Triglyceride. TC, Total cholesterol.

