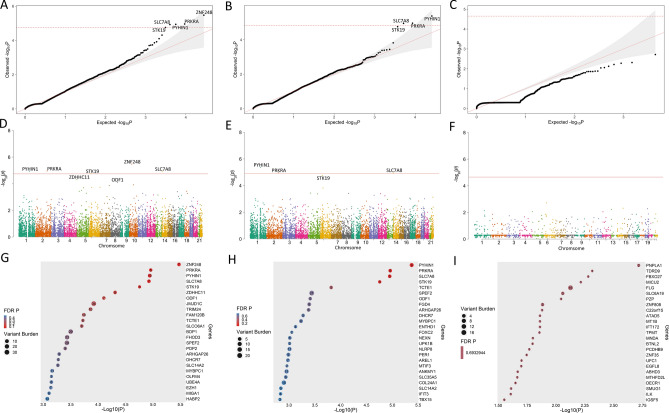
Figure 1.
Gene level results. The red lines denote FDR 5% significance threshold. Top: Quantile–Quantile Plots of Uncommon (A) Functional, (B) Damaging, and (C) Nonsense Variants. Middle: Manhattan Plots of uncommon (D) Functional, (E) Damaging, and (F) Nonsense Variants. Bottom: Bubble Plots of uncommon (G) Functional, (H) Damaging, and (I) Nonsense Variants. The number inside of each circle denotes the number of variants scored in each gene.

