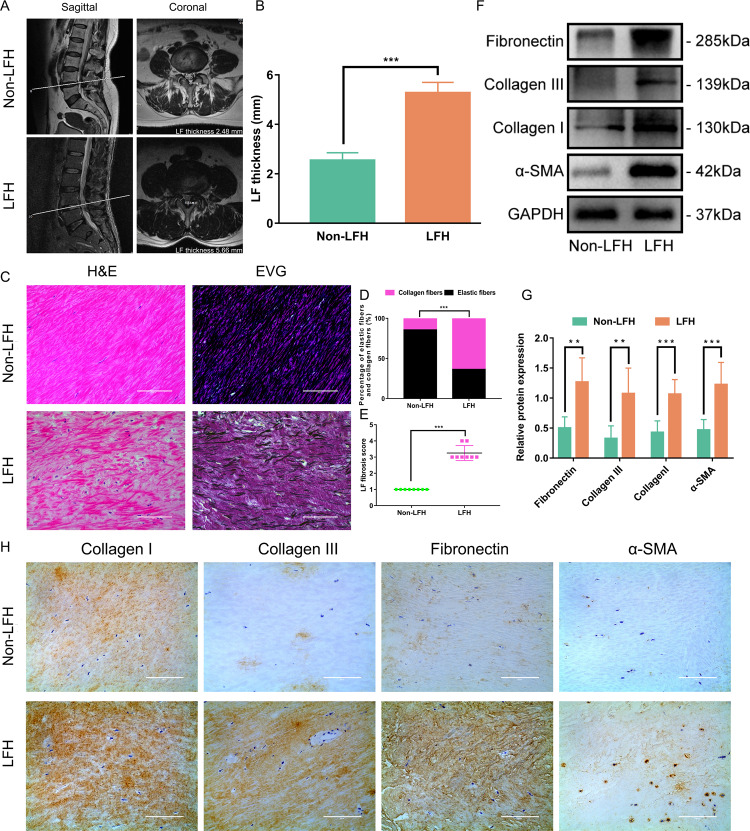
Fig. 2. Increased fibrotic degree of LF in patients with LFH.
A Coronal and sagittal MRI of LF. The LF thickness was determined on coronal MRI. B Comparison of LF thickness between the LFH group and the non-LFH group (n = 20). C Representative images of H&E staining and EVG staining of the LF samples from the two groups (n = 8). EVG staining (collagen fibers were stained pink, while elastic fibers were stained black). The scale bar indicates 100 μm. D Comparison of the percentage of collagen fibers and elastic fibers between the two groups (n = 8). E Comparison of LF fibrosis scores between the two groups (n = 8). F Western blot analysis of collagen I, collagen III, α-SMA and fibronectin protein expression in LF samples from the two groups. GAPDH was the loading control (n = 6). G Quantitative analysis of collagen I, collagen III, α-SMA and fibronectin protein expression in LF samples from the two groups (n = 6). H Representative images of immunohistochemical staining of collagen I, collagen III, α-SMA and fibronectin in LF samples from the two groups (n = 8). The scale bar indicates 100 μm. Data are presented as the means ± SDs. ns, no significance; *p < 0.05; **p < 0.01; ***p < 0.001.

