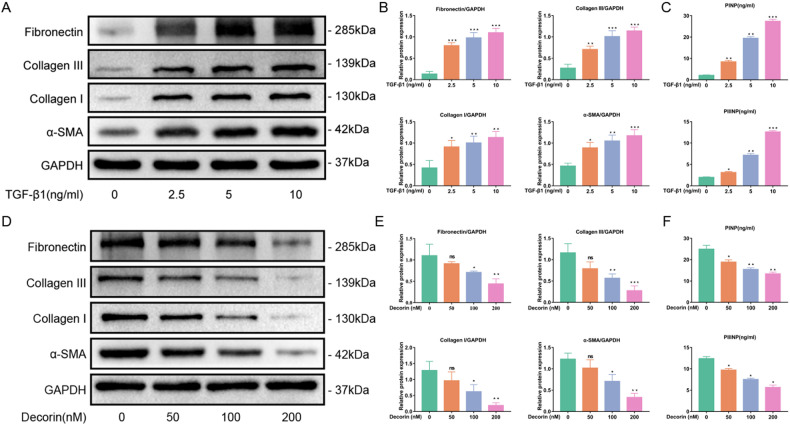
Fig. 5. TGF-β1 induced fibrosis in normal LF cells, while DCN inhibited fibrosis in hypertrophic LF cells.
A Western blot analysis and B quantitative analysis of collagen I, collagen III, α-SMA and fibronectin protein expression in normal LF cells after administration of different concentrations of TGF-β1. GAPDH was the loading control (n = 3). C ELISAs of PINP and PIIINP levels in the cell supernatant of normal LF cells after the administration of different concentrations of TGF-β1 (n = 3). D Western blot analysis and E quantitative analysis of collagen I, collagen III, α-SMA and fibronectin protein expression in hypertrophic LF cells after administration of different concentrations of DCN. GAPDH was the loading control (n = 3). F ELISAs of PINP and PIIINP levels in the cell supernatant of hypertrophic LF cells after the administration of different concentrations of DCN (n = 3). Data are presented as the means ± SDs and compared with those of the control group. ns, no significance; *p < 0.05; **p < 0.01; ***p < 0.001.

