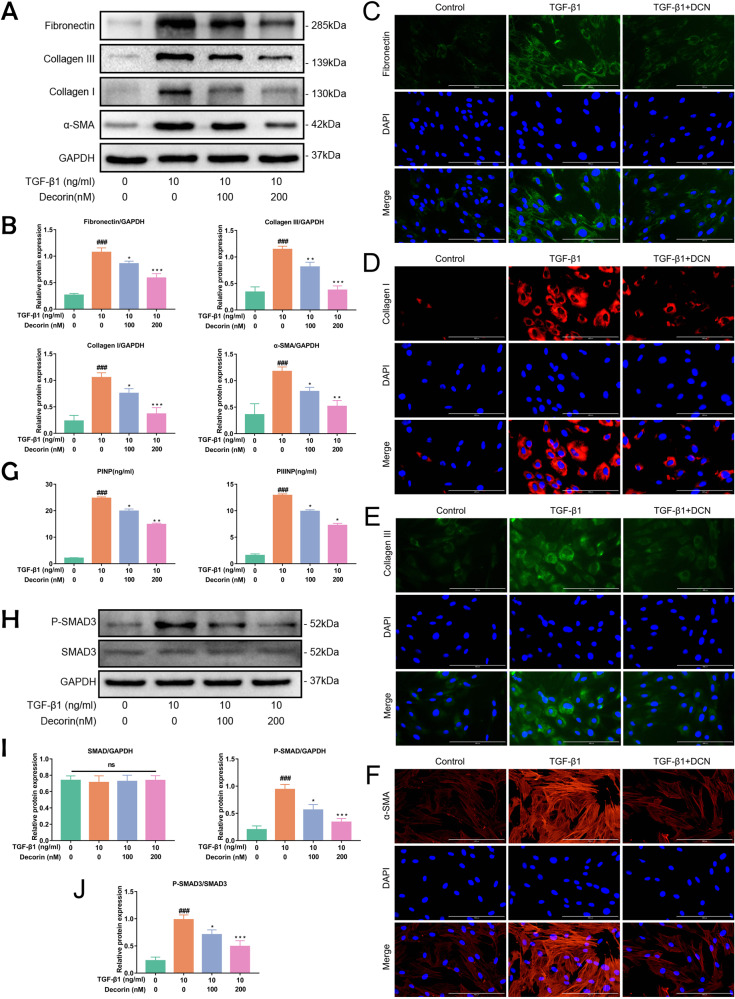
Fig. 6. DCN inhibited TGF-β1-induced fibrosis-associated protein expression in LF cells.
A Western blot analysis and B quantitative analysis of the protein expression levels of collagen I, collagen III, α-SMA and fibronectin in LF cells after intervention with 10 ng/ml TGF-β1 and different concentrations of DCN for 24 h (n = 3). C–F Immunofluorescence staining of collagen I, collagen III, α-SMA and fibronectin under different interventions for 24 h (fibronectin and collagen III were stained green; collagen I and α-SMA were stained red; DAPI, blue). Scale bar: 400 µm. G The levels of PINP and PIIINP in the cell supernatant of LF cells under different interventions for 24 h (n = 3). H Western blot analysis and I–J quantitative analysis of SMAD3 signaling protein expression levels in LF cells after intervention with 10 ng/ml TGF-β1 and different concentrations of DCN for 24 h (n = 3). Data are presented as the means ± SDs. ###p < 0.001 vs. the control group; *p < 0.05 vs. the TGF-β1 group; **p < 0.01 vs. the TGF-β1 group; ***p < 0.001 vs. the TGF-β1 group.

