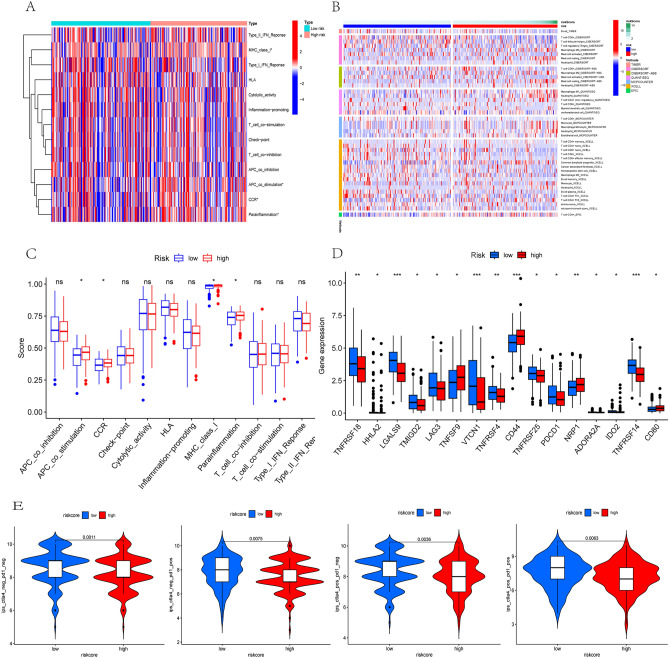
Figure 6.
Immune infiltration analysis of the signature. (A) Heatmap showed immune cells and immune function between high and low risk groups in all samples. (B) Heatmap of immune penetration based on TIMER, CIBERSORT, CIBERSORT-ABS, QUANTISEQ, MCPCOUNTER, and XCELL algorithms. (C) Differences in immune function between high- and low-DLI groups. (D) Differences in immune checkpoints between high- and low-DLI groups. (E) Differences in IPS between high- and low-DLI groups.

