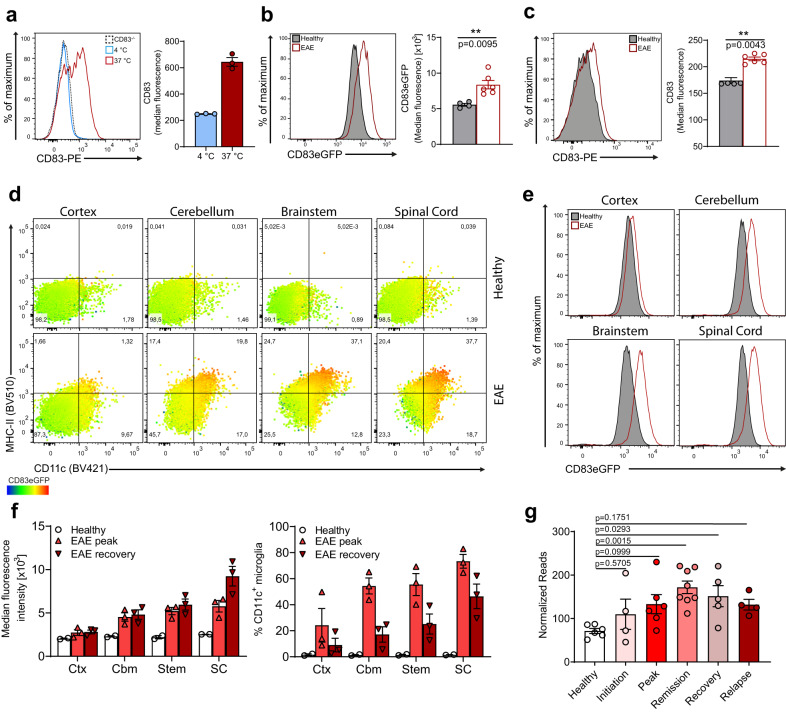
Fig. 2. Expression of CD83 in microglia increases with cellular activation but also during resolution of neuroinflammation.
a CD83 expression on microglia upon acute isolation. Freshly isolated microglia were kept either at 4 °C or 37 °C for 6 h (blue and red line, respectively), and expression was assessed via flow cytometry. Cells from CD83-/- mice served as negative controls (dotted line) (n = 3 individual mice). b, c Analyses of CD83 expression in microglia from healthy (n = 4) or EAE mice (n = 6; peak of disease, day 16 post immunization, p.i.). Statistically significant differences were detected with two-tailed Mann–Whitney U-test. d Microglia were isolated from different brain regions of healthy or EAE CD83-eGFP mice. Cells were assessed for expression of CD11c and MHC-II; dot-plots contain color mapping to visualize eGFP fluorescence and are representative of three individual mice. e Representative histogram overlay of eGFP fluorescence shown in (d). f Comparison between eGFP signal and percentage of CD11c+ microglia in healthy mice, EAE mice at the peak of disease or during the recovery phase (i.e., day 28 p.i.). g Longitudinal expression analysis of Cd83 in RR-EAE mice (n = 4–8 individual mice, sample on the respective disease stage). Statistical significance was calculated with one-way ANOVA with Dunnett’s multiple comparison test. In all graphs, data are represented as mean ± SEM.

