
Figure 2. Boxplots of the Annual Percentage Change (APC) in brain metabolites in the Anterior Cingulate Cortex (ACC).
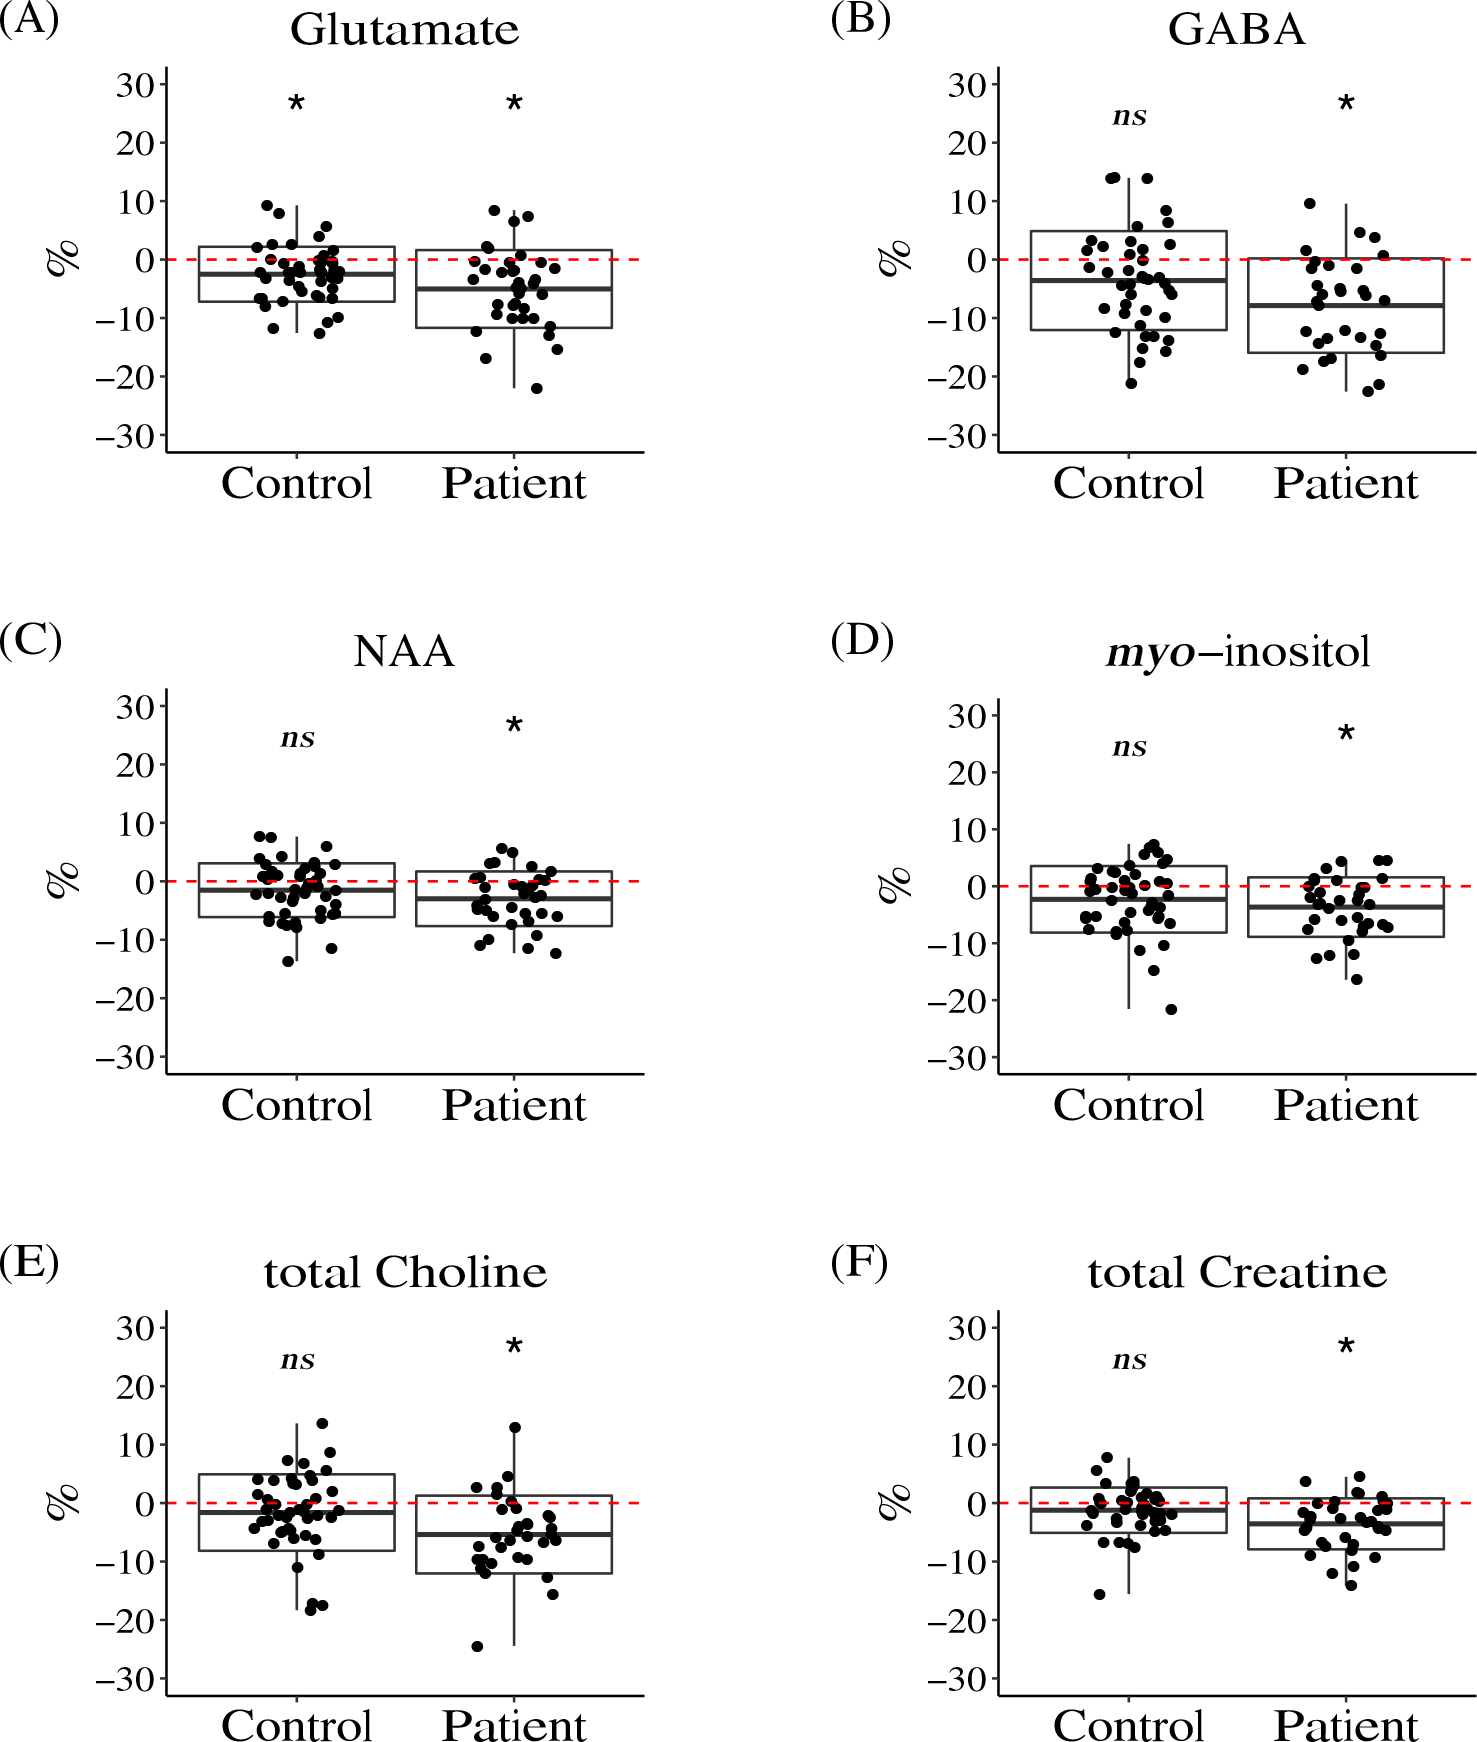
Significant longitudinal reductions were observed in glutamate (A) in both patients and controls, while for γ-aminobutyric acid (GABA) (B), N-acetylaspartate (NAA) (C), myo-inositol (D), total choline (E), and total creatine (F), significant longitudinal reductions were observed in patients, but not in controls.
The red dashed line shows the value of zero. The box represents the standard deviation and the solid line in the middle of the box shows the mean value of the APC. The black dots represent individual study participants. Symbol * denotes significant results (i.e. APC significantly different from zero), ns denotes results that didn’t reach the threshold for significance (Bayes factor > 10 and q-value < 0.05).