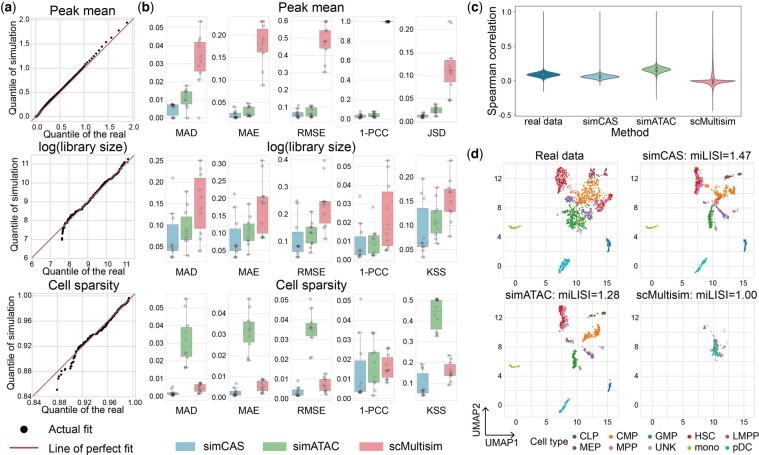
Figure 2.
Comparisons of synthetic data and real data. (a) QQ-plots of peak mean values, library size values, and cell sparsity values between synthetic common myeloid progenitors (CMPs) generated by simCAS and real CMPs in Buenrostro2018 dataset. The 1000 quantiles of peak mean values are used for the comparison. (b) Comparison results of three statistics between synthetic cell types and real cell types in Buenrostro2018 dataset. For each cell type, the similarity between statistics of synthetic data and real data is measured by six metrics: MAD, MAE, RMSE, 1-PCC, JSS, and KSS, and each gray point represents a cell type. (c) Spearman correlation coefficients of synthetic and real datasets on the pairs of top 2000 highly variable peaks selected in real data. (d) UMAP visualization of the synthetic datasets and real Buenrostro2018 dataset. The synthetic datasets are projected to the embedding space with the same low-dimensional projection trained on the real data. miLISI values are calculated to measure the mixture of synthetic cells and real cells for different simulators.

