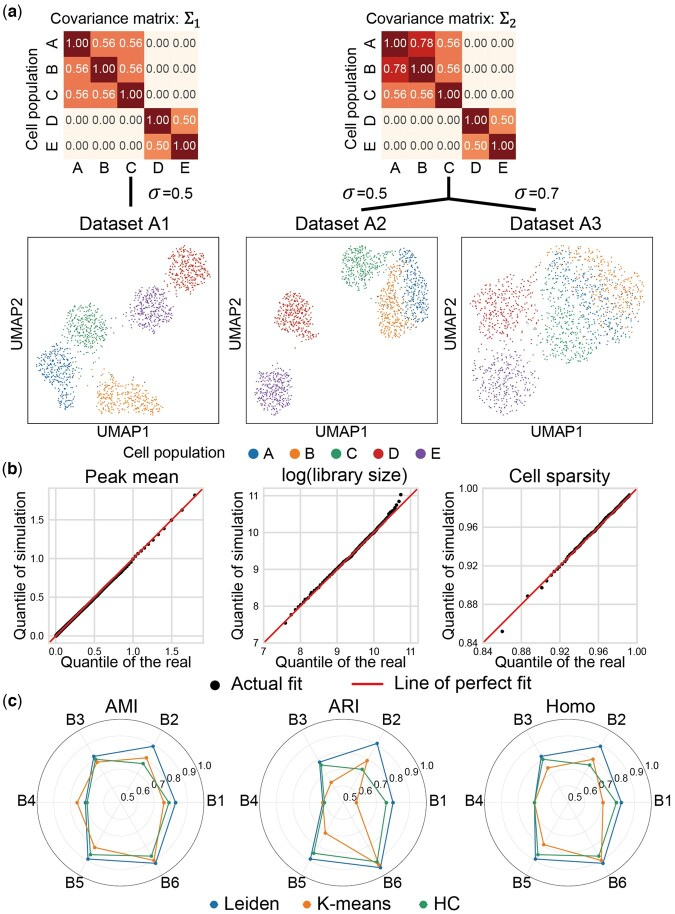
Figure 3.
Synthetic data generation in discrete mode of simCAS and benchmarking of cell clustering methods. (a) UMAP visualization of synthetic datasets (A1–A3) with discrete cell populations generated by simCAS, colored by user-defined populations in the input covariance matrices. Datasets A1 and A2 are generated with different input covariance matrices. Datasets A2 and A3 are generated with different values of variance parameter. (b) QQ-plots of peak mean values, library size values, and cell sparsity values between A1 dataset and real Buenrostro2018 dataset. Peak mean is compared using 1000 quantiles, and library size is compared using 100 quantiles as well as cell sparsity. (c) Performance benchmarking of Leiden clustering, K-means clustering, and hierarchical clustering by AMI, ARI, and Homo. Six simulated datasets (B1–B6) with discrete cell populations of cells number ranging from 500 to 3000 and populations’ number ranging from 3 to 7 are utilized for the benchmarking.

