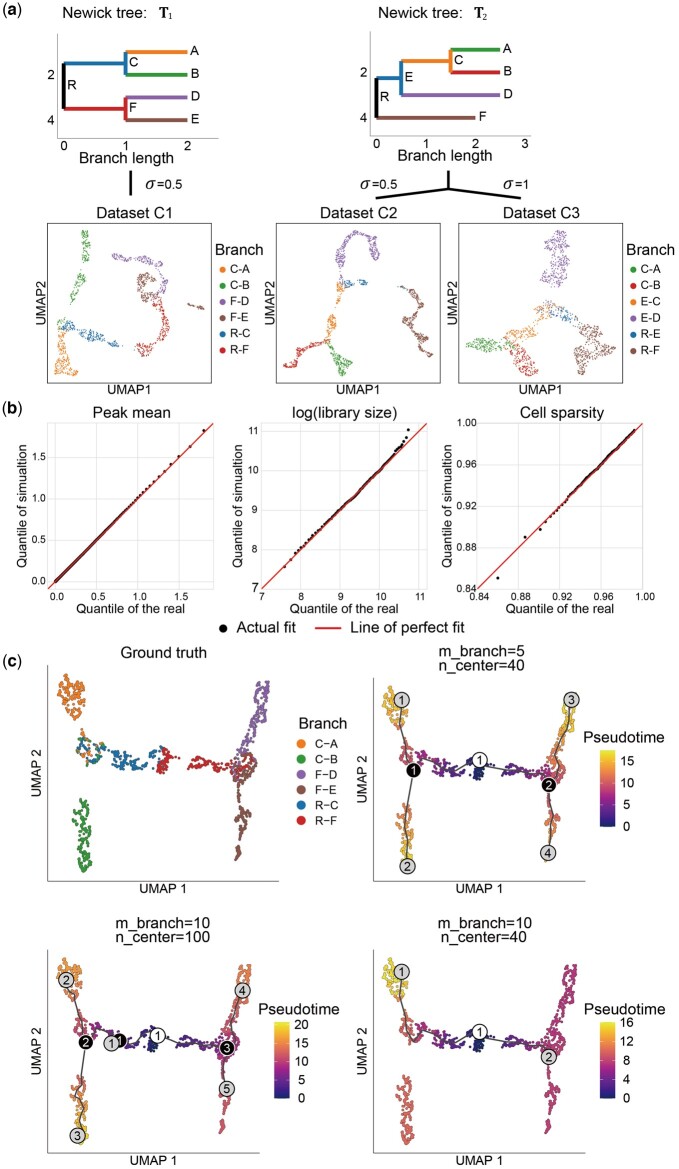
Figure 4.
Synthetic data generation in continuous mode of simCAS and benchmarking of trajectory inference method Monocle3. (a) UMAP visualization of synthetic datasets (C1–C3) with continuous trajectories generated by simCAS, colored by the branches of user-defined input trees. Datasets C1 and C2 are generated with different input trees of specific nodes and branch lengths. Datasets C2 and C3 are generated with different values of variance parameter. (b) QQ-plots of peak mean values, library size values, and cell sparsity values between C1 dataset and real Buenrostro2018 dataset. Peak mean is compared using 1000 quantiles, and library size is compared using 100 quantiles as well as cell sparsity. (c) Results of trajectory inference by Monocle3 applied on dataset C1. The performance of Monocle3 is evaluated with different values of two parameters, minimal branch length and number of centers. The inference results of cells are shown in the UMAP space, colored by the estimated pseudotime along with the inferred trajectories. White nodes, black nodes, and gray nodes represent root nodes, branch nodes, and leave nodes, respectively.

