Figure 5.
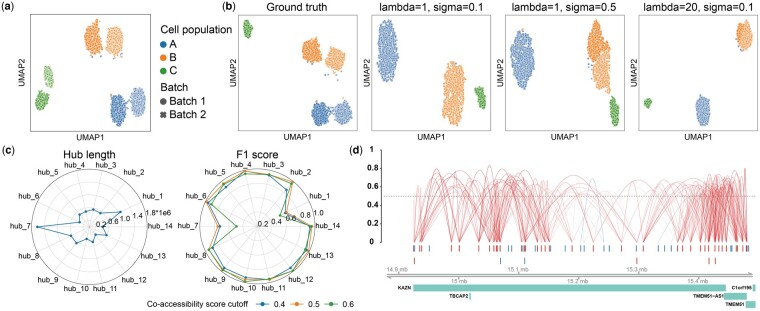
Method benchmarking results of data integration and cis-regulatory interaction inference. (a) UMAP visualization of synthetic dataset of 3000 cells with simulated biological batch effect, clustered by the cell populations and marked by different batches. (b) Results of different parameter configurations of lambda and sigma in Harmony integration method. The integration results are visualized in the UMAP space, clustered by cell populations, and marked by simulated batches. (c) Length of selected 14 peak hubs, which represent high accessible gene regions, ranging from 337 196 to 1 622 989 bp (left). Cicero is applied to infer the interactive peaks defined in these hubs with co-accessibility score of 0.4, 0.5, and 0.6, and the performance is benchmarked with the F1 score calculated between predicted peaks in CCANs and ground-truth interactive peaks in synthetic data (right). (d) The predicted connections by Cicero on the peak hub of gene KAZN region extended upstream by 50 kb and downstream by 50 kb. The 40 red peaks represent the ground-truth interactive peaks defined in the synthetic data, and the remaining 26 blue peaks are non-interactive peaks.

