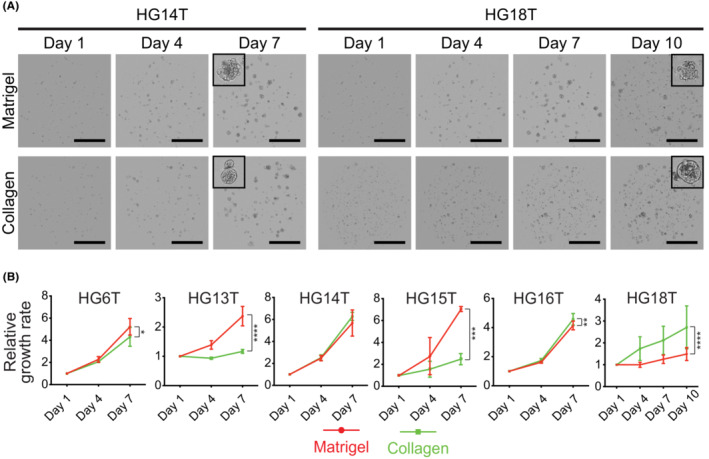
FIGURE 3.

Effects of culture matrix materials on gastric cancer stem cell (GC‐SC) spheroid growth. (A) Representative cell scanning images of HG14T (left) and HG18T (right) spheroids cultured in Matrigel (top) and collagen type‐I (collagen, bottom). Scale bar, 1 mm. (B) Growth monitoring of spheroids with optical cell imaging. The total volumes of spheroids were estimated every 3 days during post‐passage days 1 to 7 or 10. Growth rates were calibrated to the initial cell volume on day 1. Shown are the mean growth rates ± standard deviation in three independent experiments. *p < 0.05; **p < 0.01; ***p < 0.001; ****p < 0.0001, statistical significance of the data difference (two‐way ANOVA followed by Tukey's post‐test).
