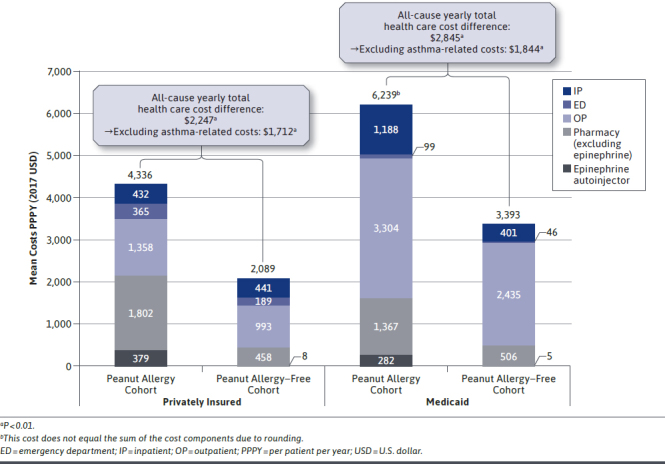
FIGURE 2.

Comparison of Direct Health Care Costs in Privately Insured Pediatric Patients in the Peanut Allergy Cohort (n = 3,084) Versus Peanut Allergy–Free Cohort (n = 30,840) and in Medicaid Pediatric Patients in the Peanut Allergy Cohort (n = 1,245) Versus Peanut Allergy–Free Cohort (n = 12,450)
