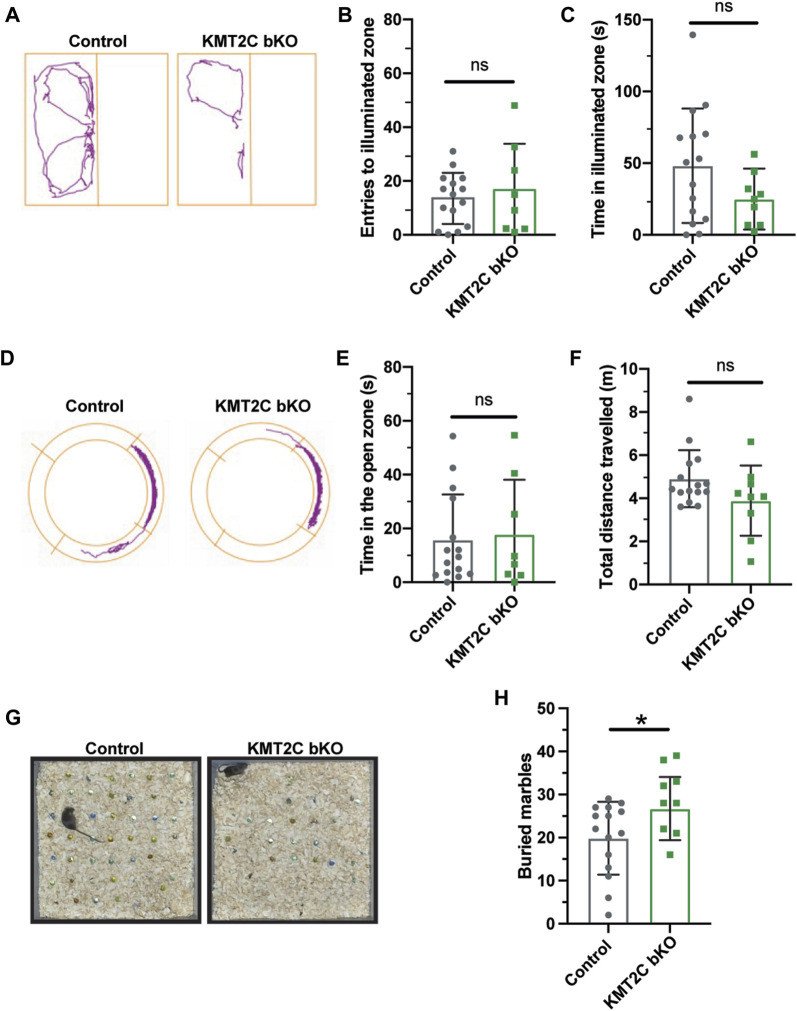
FIGURE 3.
KMT2C bKO animals evidence repetitive behaviors. (A) Representative trace plots of dark and light test. (B,C) Quantification of the number of entries to light zone (B), and the time spent in the light in the dark and light apparatus. (D) Representative trace plots of the zero-maze test. (E,F) Quantification of the time spent in the open zone (E), and the total distance travelled (F) in the zero maze. (G) Representative images of the final number of marbles buried by Control and KMT2C bKO animals. (H) Quantification of the number of marbles buried during the marble burying test. Bars represents mean ± SEM; *p < 0.05. Students t-test, n = 14 Control animals and n = 9 KMT2C bKO animals.

