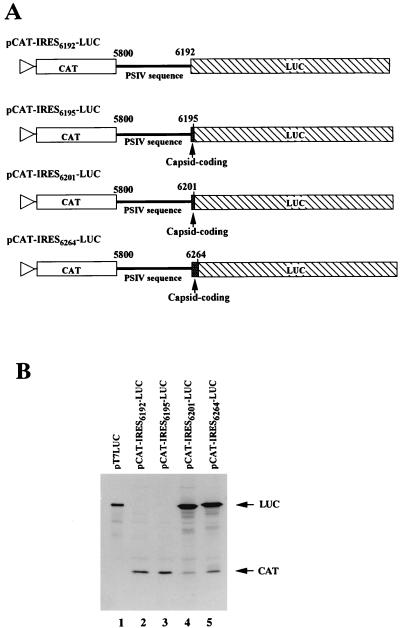
FIG. 5.
Mapping the 3′ boundary of IRES for PSIV capsid protein translation. (A) Schematic diagrams of the pCAT-IRES-LUC series of constructs. The triangles represent the location of the T7 promoter. The CAT and LUC genes are shown by open and hatched boxes, respectively. The thick lines indicate the PSIV sequences, and the shaded boxes show the PSIV capsid-coding regions. The numbers above the lines indicate the positions of the 5′- and 3′-terminal nucleotides of PSIV sequences. (B) In vitro translation products of uncapped RNAs synthesized from the pCAT-IRES-LUC series of constructs. To examine the electrophoretic mobility of the LUC protein, uncapped RNA synthesized from pT7LUC, which contains only a LUC gene, was also analyzed. The positions of the translation products (CAT and LUC) are indicated on the right of the panel.

