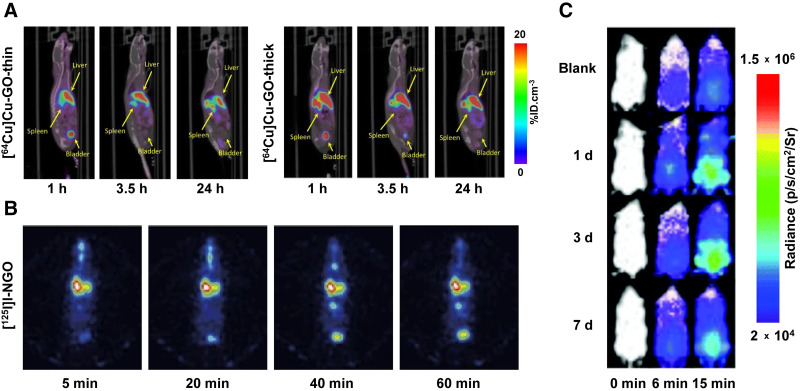
FIGURE 4.
(A) Whole-body PET/CT images of mice at 1, 3.5, and 24 h after intravenous administration of 2.51–4.55 MBq (50 μg) of [64Cu]Cu-GO-thin (left) or [64Cu]Cu-GO-thick (right). (Reprinted with permission of (34).) (B) SPECT images of mice at 5, 20, 40, and 60 min after intratracheal administration of [125I]I-nanoscale GO (1.85 MBq) (37). (C) Bioluminescence images of mice at 1, 3, and 7 d after intravenous administration of Hg2+ (0.02 μmol) and facilitated using intraperitoneally injected Hg2+-sensitive probe. (Reprinted with permission of (38).) %ID = percent injected dose.

