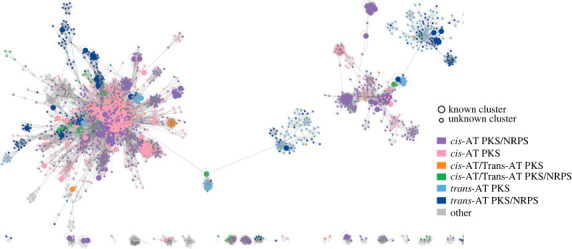
Figure 6.

Zoomed in view of sequence similarity network of the 8799 distinct assembly line PKSs visualized using Cystoscape 3.9. Nodes correspond to known (larger circles) and orphan (smaller circles) PKSs and are colour-coded according to antiSMASH predictions (legend). Edges represent greater than 50% sequence similarity between two PKSs. The full network is shown in electronic supplementary material, figures S4 and S5.
