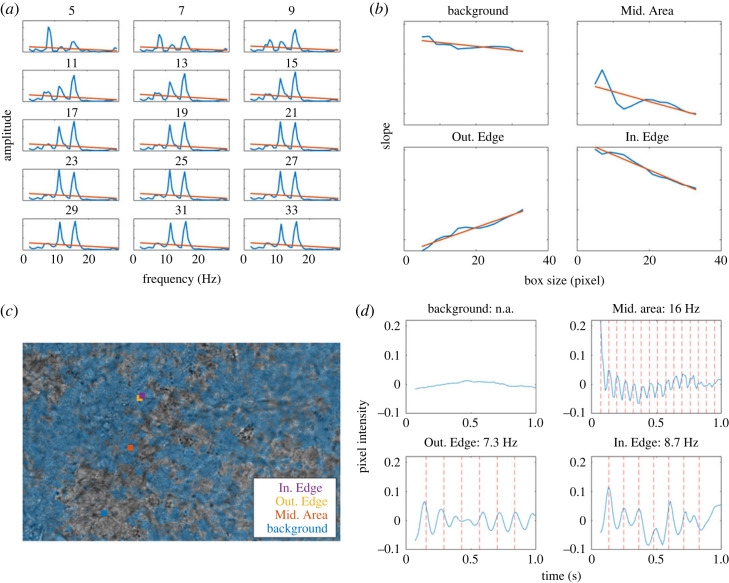
Figure 3.
Analysis of frequency spectra, over progressively larger ‘boxes’, leads to identifying four classes of pixels: those deep inside or outside a ciliated area, and these just outside or inside an edge between ciliated and non-ciliated. Figure shows the processing stages to determine the movement map, i.e. the pixels in ciliated regions. (a) Example of the slope map Ms obtained for each box size of an individual pixel. (b) Estimated variation of Ms over each box size, for the selected areas from 5 by 5 to 33 by 33 pixels, as marked. (c) Binarized movement map overlaid on top of the FOV, blue shaded areas are marked as presenting movement. Video available in electronic supplementary material and in data repository. Overlaid are selected areas for visualization in the FOV, corresponding to an area just outside of an area containing moving cilia (Out. Edge), just inside of a moving region (In. Edge), in the middle of larger area of movement (Mid. Area), and on an area with no noticeable movement in its surrounding (Background). FOV is ≈187 μm by 117 μm). (d) Pixel intensity for each area over 1 s, red lines correspond to beats based on the frequency measured over that pixel, matching the pixel intensity over time.

