
Table 1. Summary of seven alkanoic acids (R2=H): the molecular properties and results of positive-ion APCDI mass spectra obtained by the Q-orbitrap MS.
| Molecular properties | Results of positive-ion APCDI mass spectra: m/z, chemical formula, and relative intensities (%) of major ions | |||||||||
|---|---|---|---|---|---|---|---|---|---|---|
| Analyte (M) | Molecular mass (nominal Da) | Formula | R1 | R2 | Protonated molecule, [M+H]+ | NH4+ adduct, [M+NH4]+ | H2O loss from protonated molecule, R1CO+ | |||
| Acetic acid | 60 | C2H4O2 | CH3 | H | 61.0283 | 100 | 78.0548 | 71.2 | N.D.a | |

|
C2H5O+ | C2H8O2N+ | ||||||||
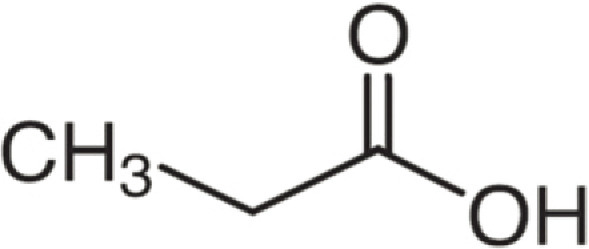
| Propanoic acid | 74 | C3H6O2 | C2H5 | H | 75.0439 | 100 | 92.0703 | 24.2 | 57.0333 | 3 |
|
C3H7O2+ | C3H10O2N+ | C3H5O+ | |||||||
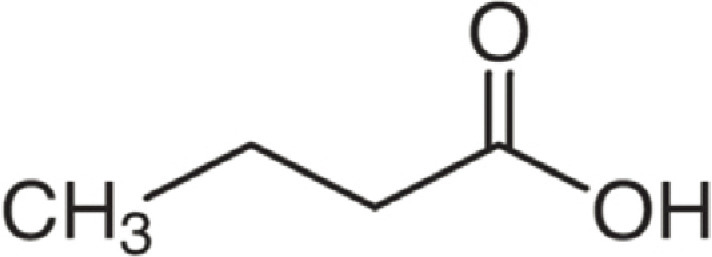
| Butanoic acid | 88 | C4H8O2 | C3H7 | H | 89.0595 | 100 | 106.086 | 31.7 | 71.049 | 5 |
|
C4H9O2+ | C4H12O2N+ | C4H7O+ | |||||||
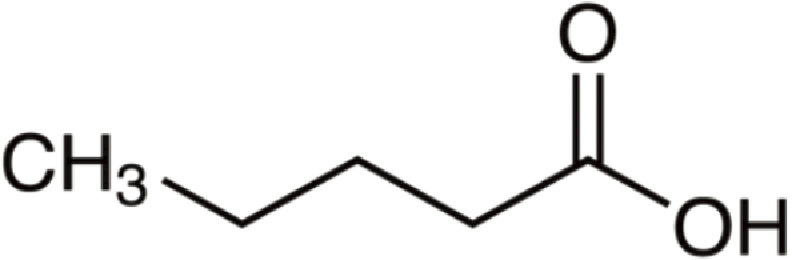
| Pentanoic acid | 102 | C5H10O2 | C4H9 | H | 103.0751 | 100 | 120.1016 | 18.6 | 85.0646 | 3.3 |
|
C5H11O2+ | C5H14O2N+ | C5H9O+ | |||||||
| Hexanoic acid | 116 | C6H12O2 | C5H11 | H | 117.0907 | 100 | 134.1171 | 37.6 | 99.0802 | 4.1 |

|
C6H13O2+ | C6H16O2N+ | C6H11O+ | |||||||
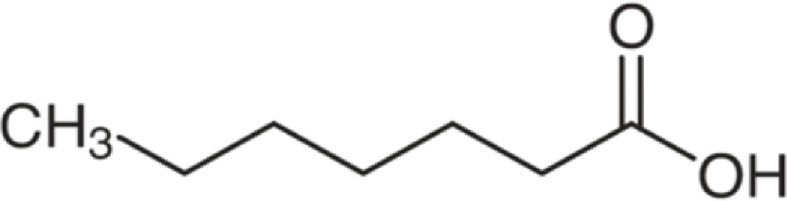
| Heptanoic acid | 130 | C7H14O2 | C6H13 | H | 131.1058 | 100 | 148.1321 | 11.3 | 113.0953 | 2.5 |
|
C7H15O2+ | C7H18O2N+ | C7H13O+ | |||||||
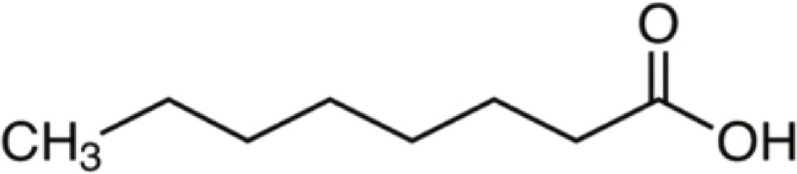
| Octanoic acid | 144 | C8H16O2 | C7H15 | H | 145.1221 | 100 | 162.1486 | 19.4 | 127.1116 | 3.4 |
|
C8H17O2+ | C8H20O2N+ | C8H15O+ | |||||||
aNot detected due to detection limit of m/z range.
APCDI, atmospheric pressure corona discharge ionization technique; MS, mass spectrometry.