
Table 2. Summary of seven methyl esters (R2=CH3): the molecular properties and results of positive-ion APCDI mass spectra obtained by the Q-orbitrap MS.
| Molecular properties | Results of positive-ion APCDI mass spectra: m/z, chemical formula, and relative intensities (%) of major ions | |||||||||
|---|---|---|---|---|---|---|---|---|---|---|
| Analyte (M) | Molecular mass (nominal Da) | Formula | R1 | R2 | Protonated molecule, [M+H]+ | NH4+ adduct, [M+NH4]+ | CH3OH loss from protonated molecule, R1CO+ | |||
| Methyl acetate | 74 | C3H6O2 | CH3 | CH3 | 75.0439 | 100 | 92.0703 | 29.3 | N.D.a | |

|
C3H7O2+ | C3H10O2N+ | ||||||||
| Methyl propionate | 89 | C4H8O2 | C2H5 | CH3 | 89.0595 | 100 | 106.086 | 16.8 | 57.0334 | <1 |

|
C4H9O2+ | C4H12O2N+ | C3H5O+ | |||||||
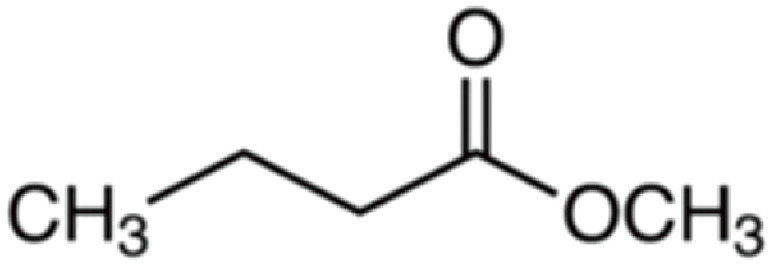
| Methyl butyrate | 102 | C5H10O2 | C3H7 | CH3 | 103.075 | 100 | 120.102 | 47.5 | 71.049 | 1 |
|
C5H11O2+ | C5H14O2N+ | C4H7O+ | |||||||
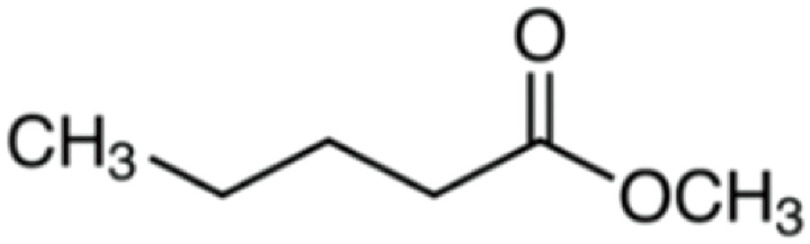
| Methyl valerate | 116 | C6H12O2 | C4H9 | CH3 | 117.091 | 100 | 134.117 | 13.5 | 85.0648 | <1 |
|
C6H13O2+ | C6H16O2N+ | C5H9O+ | |||||||
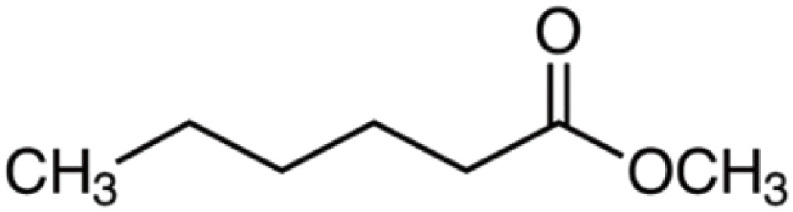
| Methyl hexanoate | 130 | C7H14O2 | C5H11 | CH3 | 131.106 | 100 | 148.132 | 27.9 | 99.0804 | <1 |
|
C7H15O2+ | C7H18O2N+ | C6H11O+ | |||||||
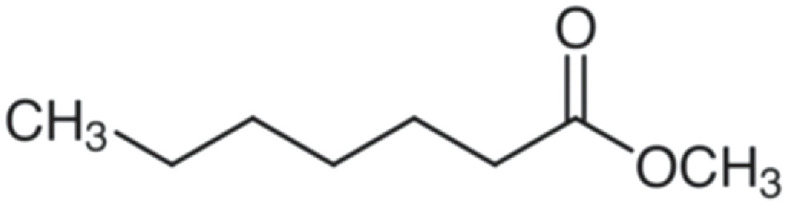
| Methyl heptanoate | 144 | C8H16O2 | C6H13 | CH3 | 145.121 | 100 | 162.148 | 11.6 | 113.096 | <1 |
|
C8H17O2+ | C8H20O2N+ | C7H13O+ | |||||||
| Methyl octanoate | 158 | C9H18O2 | C7H15 | CH3 | 159.138 | 100 | 176.164 | 76.7 | 127.112 | <1 |

|
C9H19O2+ | C9H22O2N+ | C8H15O+ | |||||||
aNot detected due to detection limit of m/z range.
APCDI, atmospheric pressure corona discharge ionization technique; MS, mass spectrometry.