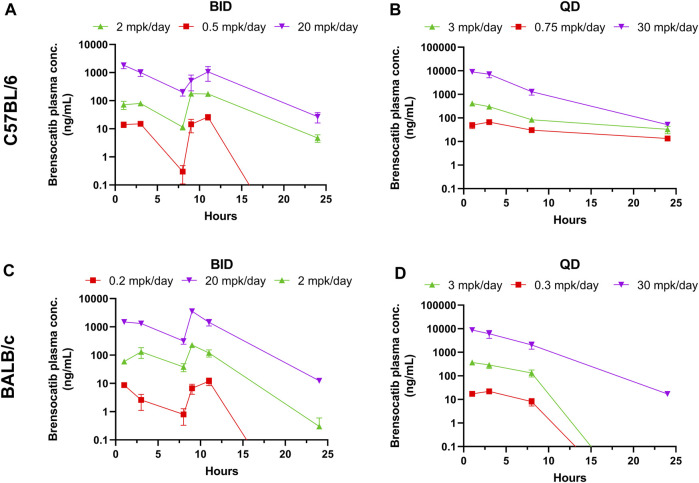
FIGURE 1.
Brensocatib Plasma Concentrations from Repeated Dose Administration of Brensocatib by Oral Gavage. (A) BID in C57BL/6 mice, (B) QD in C57BL/6 mice, (C) BID in BALB/c mice (D) QD in BALB/c mice. Data are plotted as mean ± SEM (n = 4, except for 11 h of 20 mg/kg BID in C57 where n = 3; 3 mg/kg QD in C57 for all time points where n = 6; 30 mg/kg QD in C57 for all time points where n = 6; and 1 h of 2 mg/kg BID in BALB/c where n = 3). mpk/day = mg/kg/day.

