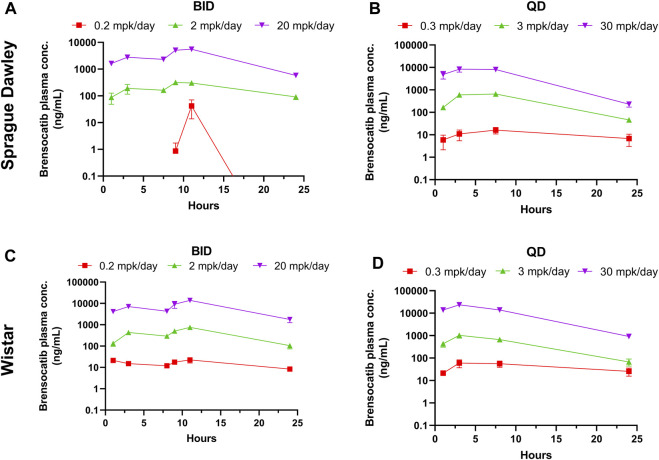
FIGURE 3.
Bensocatib Plasma Concentration from Repeated Dose Administration of Brensocatib by Oral Gavage. (A) BID in Sprague Dawley (SD) rats, (B) QD in SD rats, (C) BID in Wistar rats, (D) QD in Wistar rats. Data are plotted as mean ± SEM (n = 4, except for 0.2 mpk/day BID for SD at 1, 3, 9, and 24 h where n = 3; 2 mpk/day BID at 11 h for SD where n = 3; 0.3 mpk/day QD at 3 h for SD where n = 3; 3 mpk/day BID for SD at 3 and 24 h where n = 3; 30 mpk/day BID at 7.5 h for SD where n = 3; 0.2 mpk/day BID at 16 h for Wistar where n = 3; and 30 mpk/day QD at 8 h for Wistar where n = 3). mpk/day = mg/kg/day.

