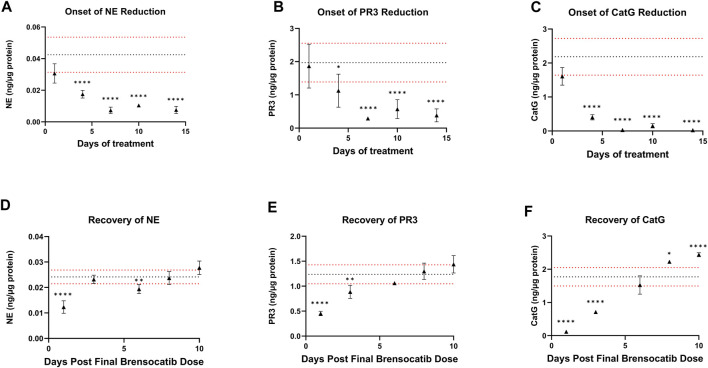
FIGURE 5.
(A–C) Onset and (D–F) Recovery of NSP Activities in Bone Marrow of C57BL/6 Mice Administered Repeated Doses of Brensocatib. The dotted horizontal lines represent the average (black) ± 1 SD (red) for the vehicle control. Data are plotted as mean ± SD (n = 4 for all brensocatib treatment groups, except for onset NE day 10, recovery PR3 day 6, and recovery CatG day 8 where n = 3 after removal of an outlier determined by Grubb’s test; n = 20 for vehicle control, except onset PR3 and recovery CatG where n = 19 after removal of outlier determined by Grubb’s test). *, p < 0.05 vs. vehicle; **, p < 0.01 vs. vehicle; ***, p < 0.001 vs. vehicle; ****, p < 0.0001 vs. vehicle.

