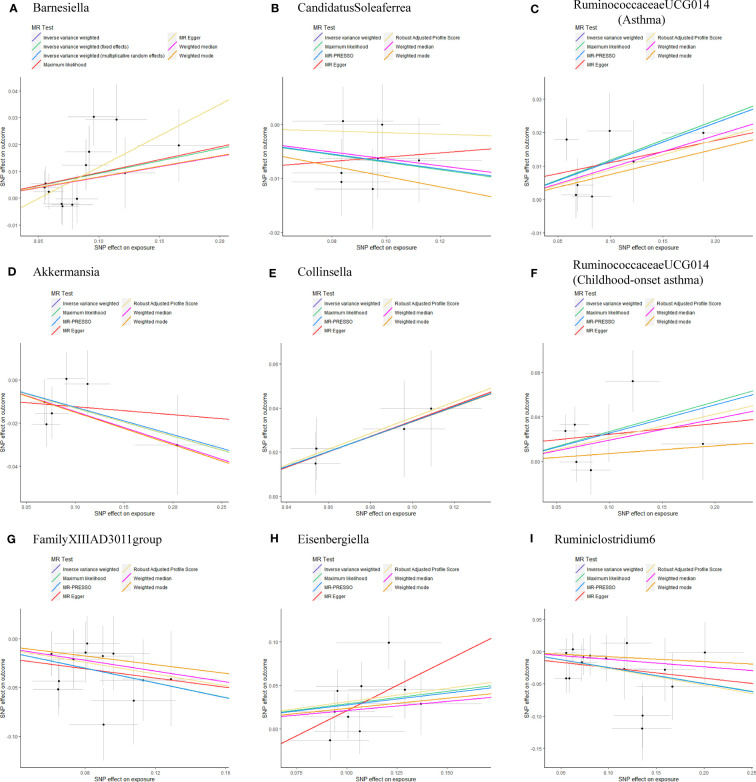
Figure 1.
Scatterplots of potential effects of SNPs on Gut microbiota versus Asthma and its phenotypes (A) Barnesiella; (B) CandidatusSoleaferrea; (C) RuminococcaceaeUCG014(Asthma); (D) Akkermansia; (E) Collinsella; (F) RuminococcaceaeUCG014(Childhood-onset asthma); (G) FamilyXIIIAD3011group; (H) Eisenbergiella; (I) Ruminiclostridium6. Scatter plots presented the per-allele association with outcome risk plotted against the per-allele association with one standard deviation of exposure (with vertical and horizontal purple lines showing the 95% CI for each SNP). Analyses were conducted using the Inverse Variance Weighting (IVW), Weighted median, Wald ratio, Robust Adjusted Profile Score (RAPS), MR Egger, MR-PRESSO, and Maximum likelihood (ML) methods. The slope of each line corresponding to the estimated MR effect per method. CI, confidence interval; SNP, single-nucleotide polymorphism; MR-PRESSO, Mendelian Randomization Pleiotropy RESidual Sum and Outlier.

