
Figure 3. Decreased levels and defective functions of bone marrow (BM)-isolated neutrophils from young male Sat1p.Glu92Leufs*6 mice.
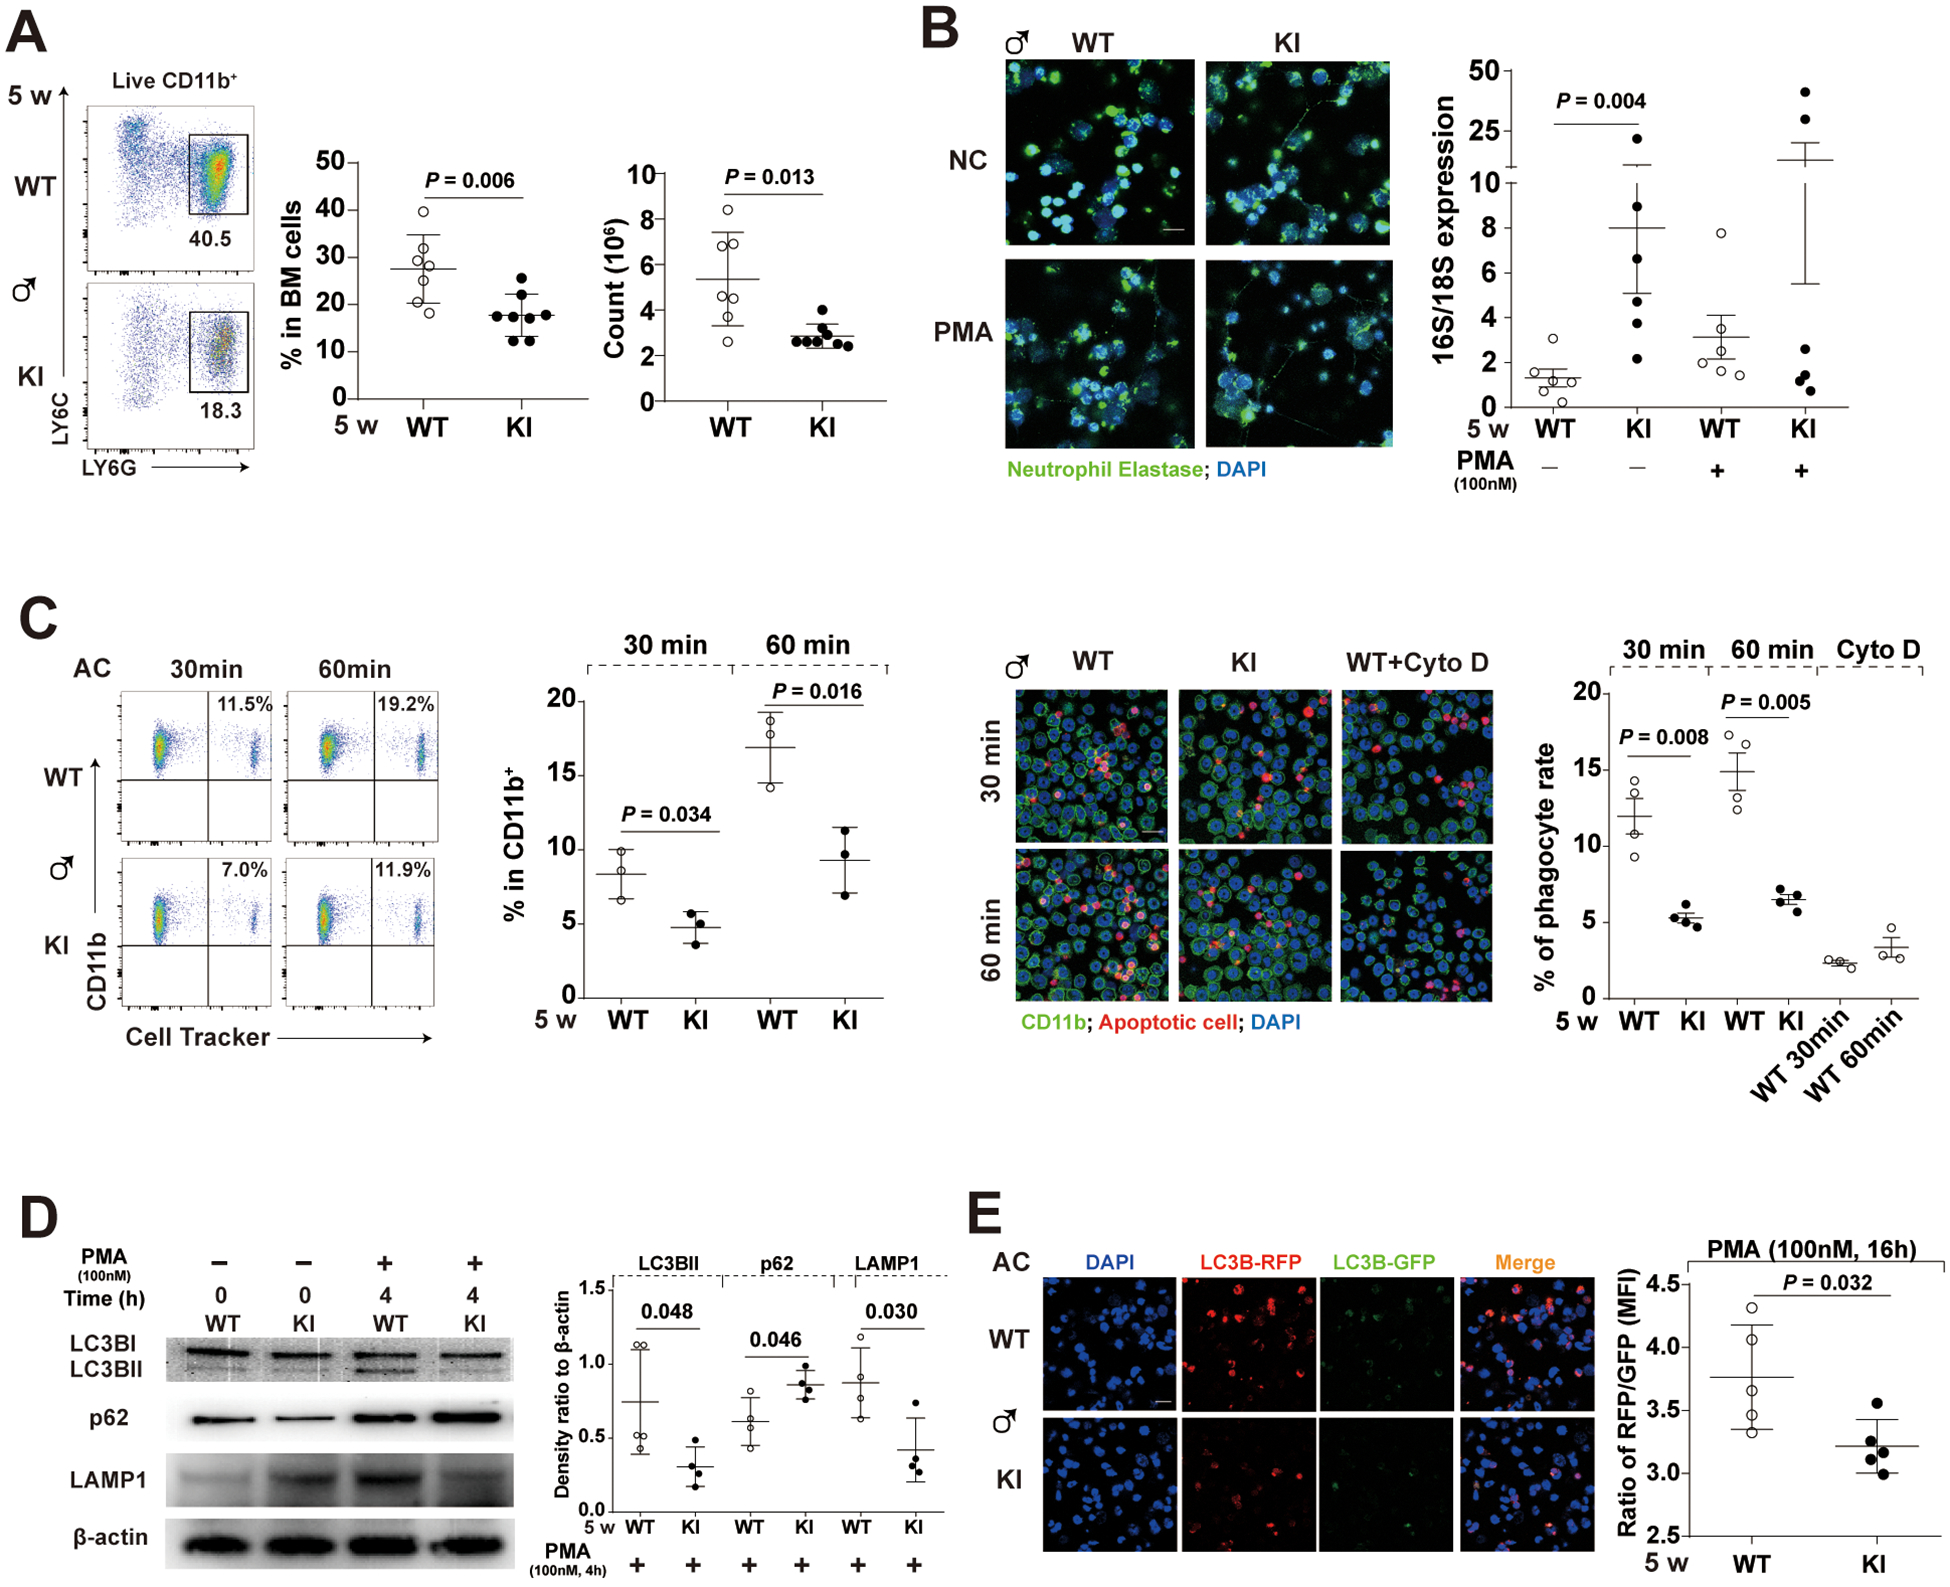
(A) Gating strategy, decreased percentage, and cell numbers of BM-isolated neutrophils (CD11b+LY6G+LY6Cint) in 5-week-old male KI mice compared to their WT littermates. Data are mean ± SD. Mann-Whiney U test.
(B) (Left) Representative images of the Neutrophil extracellular traps (NET) induced by PMA in BM-isolated neutrophils. (Right) Quantitation of mitochondrial (16S; officially known as MT-RNR2) and chromosomal (18S; officially known as RNA18S5) DNA in the immuno-precipitated total oxidized DNA from overnight culture supernatants of BM-isolated neutrophils of either WT or KI littermates incubated in the absence (spontaneous NETosis) or presence of PMA (induced NETosis). Green immunofluorescence represents neutrophil elastase and blue represents DNA (Hoechst_33342) of confocal images. Bar: 10μm; PMA, phorbol myristate acetate, 100nM; Incubation time, 24 hours. Data are mean ± SD. Mann-Whiney U test.
(C) Defective engulfment of Cell Tracker-labeled apoptotic cells (AC) by BM-isolated neutrophils from 5-week-old male KI mice after 30- or 60- min co-cultures assessed by either flow cytometry or confocal microscopy; BM-isolated neutrophils: AC=1:5. Cyto D, Cytochalasin D, an inhibitor of actin polymerization, at 10μM; Bar: 10μm. Data are mean ± SD. Unpaired t-test.
(D) Representative Western blot of LC3B, p62 (an autophagosome cargo protein), LAMP1 and β-actin, and quantification of relative levels of LC3B-II to LC3B-I, and relative levels of p62 or LAMP1 to β-actin in PMA-stimulated groups. PMA, 100nM. Bar: 10μm. Incubation time, 4 hours. Data are mean ± SD. Unpaired t-test.
(E) Decreased levels of autophagic flux in PMA-treated BM-isolated neutrophils from 5-week-old male KI mice. The left panel depicts representative fluorescence images of autophagic flux assays using an RFP-GFP-LC3B tandem construct that only the GFP signal could be quenched by the acidic lysosomal pH, and the right panel depicts relative ratios of RFP: GFP in each group. Bar: 10μm; PMA, 100nM; Incubation time, 16 hours. Data are mean ± SD. Unpaired t-test.