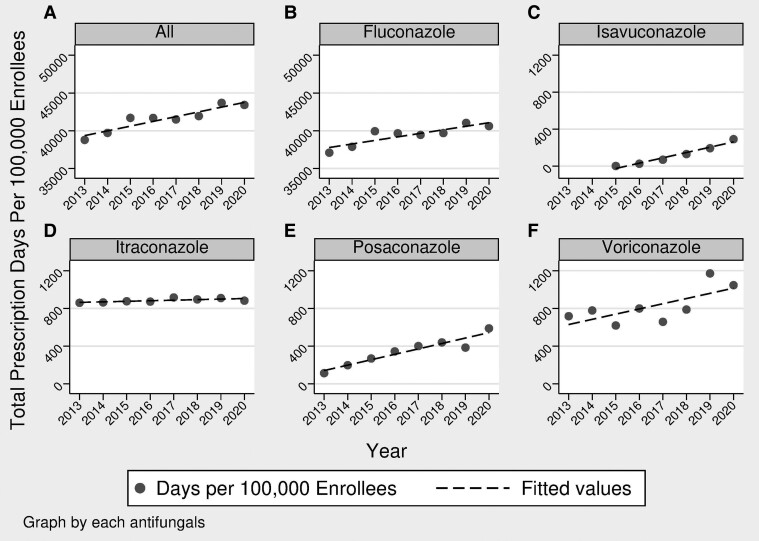
Figure 2.
Azole total days supply (TDS) per 100 000 enrollees for 2013 through 2020 showing trends over the years. (A) All triazole antifungals rose by 11.95%, (B) fluconazole rose by 9.48%, (C) isavuconazole rose by 1050.6%, (D) itraconazole rose by 2.7%, (E) posaconazole rose by118.9%, and (F) voriconazole rose by 45.9%. Besides posaconazole, which was analyzed over 2015–2020, and isavuconazole, which was analyzed over 2016–2020, all other panels show analysis over 2013–2020.

