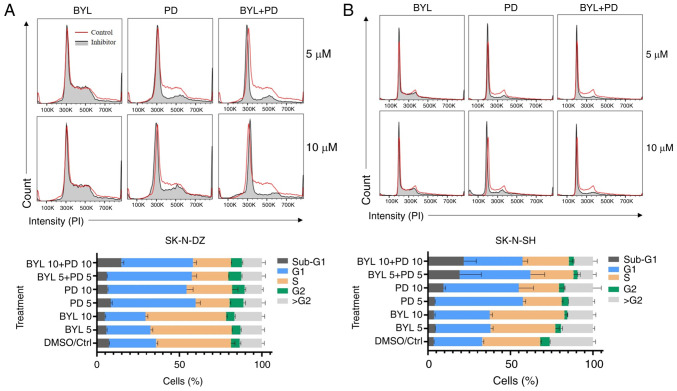
Figure 6.
Cell cycle profiles of SK-N-DZ and SK-N-SH obtained by FACS analysis. Cell cycle distribution of (A) SK-N-DZ and (B) SK-N-SH NB cell lines treated with CDK4/6 and PI3K inhibitors PD and BYL for 48 h. BYL, BYL719; PD, PD-0332991; CDK4/6, cyclin-dependent kinase-4/6; PI3K, phosphoinositide 3-kinase.

