Fig. 1.
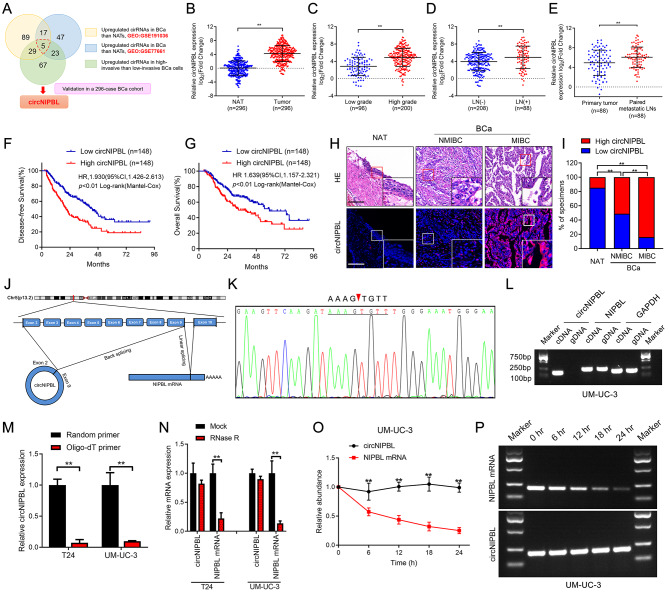
The identification and characterization of circNIPBL in BCa. (A) Schematic illustration for screening the upregulated circRNAs in bladder cancer tissues and high-invasive bladder cancer cells. (B) qRT-PCR for the circNIPBL expression in BCa tissues (n = 296) paired with NATs (n = 296). (C, D) qRT-PCR analysis of the circNIPBL expression in 296 BCa tissues with respect to pathological grade (C) and LN status (D). (E) qRT-PCR for the circNIPBL expression in primary tumor (n = 88) paired with metastatic LNs (n = 88). (F, G) Kaplan-Meier survival curves for OS (F) and DFS (G) of low and high circNIPBL expression level in patients with BCa. The median expression level of circNIPBL was taken as the cutoff value. (H, I) Representative images (H) and proportion (I) for RNA fluorescence in situ hybridization showed that circNIPBL was upregulated in MIBC tissues compared with NMIBC tissues. Scale bar = 50 μm and 20 μm. (J) Schematic illustration showing the genomic loci of the NIPBL gene and the circNIPBL derived from exon 2 to 9 of NIPBL. (K) Sanger sequencing for the back-splice junction site of circNIPBL. (L) PCR analysis for circNIPBL and NIPBL in the cDNA and gDNA of UM-UC-3 cells. GAPDH was used as normal control. (M) qRT-PCR analysis of circNIPBL expression using random primers or oligo-dT primers. (N) circNIPBL and NIPBL expression in BCa cells analyzed by qRT-PCR following RNase R treatment in UM-UC-3 and T24 cells. (O, P) Actinomycin D assay (O) and agarose gel electrophoresis assay (P) to assess the stability of circNIPBL and NIPBL mRNA in UM-UC-3 cells at the indicated time points. The statistical difference was assessed through the nonparametric Mann–Whitney U test in B-G and the χ2 test in I; and the two-tailed Student t test in M-O. Error bars show the SD from three independent experiments. *p < 0.05 and **p < 0.01

