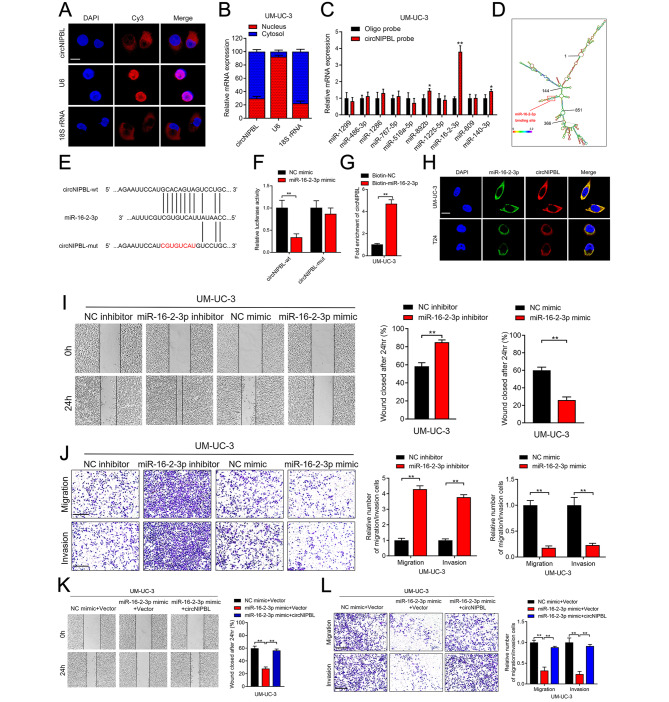
Fig. 3.
circNIPBL serves as a sponge for miR-16-2-3p in BCa cells. (A) FISH assay was used to detect the cellular localization of circNIPBL. Scale bar = 5 μm. (B) Subcellular fractionation assay was used to confirm the cellular localization of circNIPBL in UM-UC-3 cells. U6 was used for the nuclear control and 18 S rRNA was used for the cytoplasmic control. (C) The expression level of ten predicted target miRNAs of circNIPBL were analyzed by qRT-PCR in UM-UC-3 cells. (D) RNAalifold was used to predict the secondary structure of circNIPBL. (E) Schematic illustrating the sequence alignment of circNIPBL with miR-16-2-3p. (F) Dual luciferase reporter assays showed that the luciferase activities of the circNIPBL-wt plasmid or circNIPBL-mut plasmid quantified following co-transfection with either the miR-16-2-3p or control mimics. (G) qRT-PCR analysis showed the circNIPBL captured by biotinylated miR-16-2-3p. (H) The co-localization of circNIPBL and miR-16-2-3p was detected by FISH assay. Scale bar = 5 μm. (I) Representative images and quantification of Wound healing assay showed the migration capability of UM-UC-3 cells transfected with miR-16-2-3p mimics or inhibitors. Scale bar = 100 μm. (J) Representative images and quantification of Transwell migration and Matrigel invasion assays showed the effect of UM-UC-3 cells transfected with miR-16-2-3p mimics or inhibitors. Scale bar = 100 μm. (K, L) Representative images and quantification of wound healing assay (K), Transwell migration and Matrigel invasion assays (L) by indicated UM-UC-3 cells. Scale bar = 100 μm. The statistical difference was assessed with one-way ANOVA followed by Dunnett tests in K and L; and the two-tailed Student t test in C, F, G, I and J; and the χ2 test in B. Error bars show the SD from three independent experiments. *p < 0.05 and **p < 0.01

