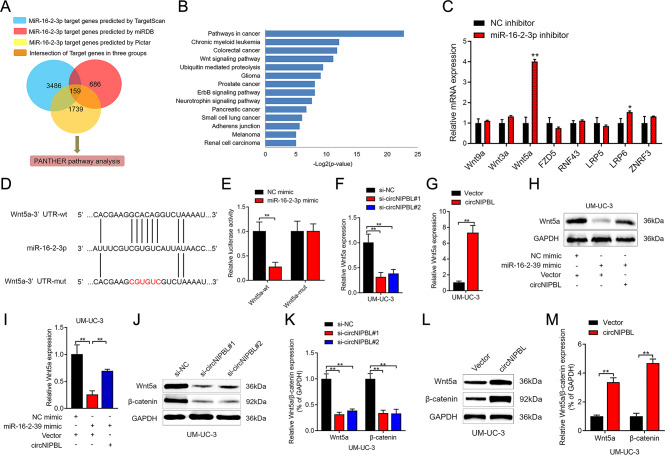
Fig. 4.
circNIPBL attenuates miR-16-2-3p-mediated Wnt signaling suppression. (A) Schematic illustration showing the downstream targets of miR-16-2-3p as predicted by the TargetScan, Pictar and miRDB databases. (B) KEGG pathway enrichment analysis with PANTHER database of BCa. (C) qRT-PCR analysis of Wnt signaling pathway-related genes in circNIPBL overexpressing BCa cells. (D) Schematic illustration showed the alignment of miR-16-2-3p with Wnt5a and the mutagenesis nucleotides were indicated by the red portion. (E) The luciferase activities of the Wnt5a-wt plasmid or Wnt5a-mut plasmid quantified following transfecting control mimic or miR-16-2-3p mimic into BCa cells. (F, G) qRT-PCR analysis of the impact of circNIPBL knockdown (F) or circNIPBL overexpression (G) on Wnt5a expression in UM-UC-3 cells. (H, I) Representative images (H) and quantification (I) of Western blotting assay of Wnt5a in indicated UM-UC-3 cells. (J-M) Western blotting assay showed the expression levels of Wnt5a and β-catenin after circNIPBL knockdown (J, K) or circNIPBL overexpression (L, M) in UM-UC-3 cells. The statistical difference was assessed with one-way ANOVA followed by Dunnett tests in F, I and K; and the two-tailed Student t test in C, E, G and M. Error bars show the SD from three independent experiments. *p < 0.05 and **p < 0.01

