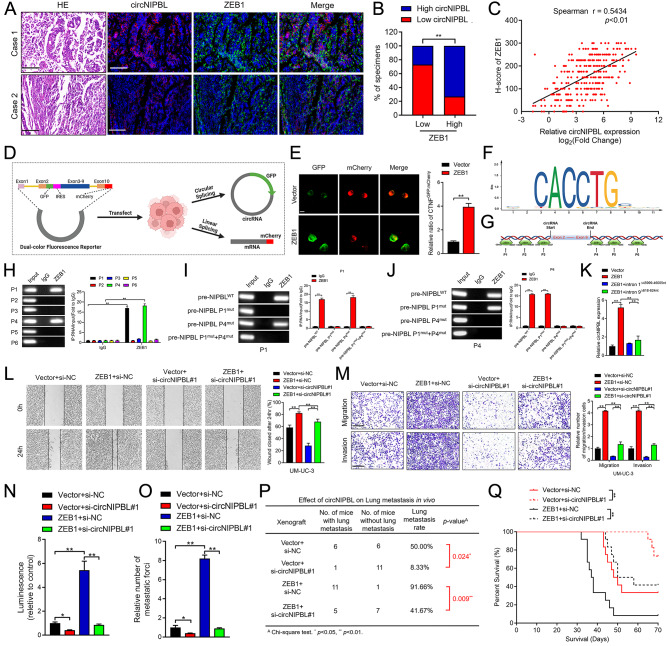
Fig. 6.
ZEB1 binds to the flanking intron of pre-mRNA to trigger circNIPBL biogenesis. (A-C) Representative images (A) and quantification (B, C) of ZEB1–indicated circNIPBL expression was detected by RNA fluorescence in situ hybridization assay in BCa tissues. Scale bar = 50 μm. (D) Schematic illustration of the dual-color fluorescence reporter. (E) Representative images and quantification of circNIPBL and NIPBL mRNA expression in BCa cells. Scale bar = 5 μm. (F) The potential ZEB1 binding motifs in NIPBL pre-mRNA were predicted by JASPAR online database. (G) ZEB1-binding sites in the flanking regions of NIPBL pre-mRNA were predicted by Circinteractome online database. (H) Representative images and quantification of RIP assay using anti-ZEB1 antibody to validate the putative binding sites. (I, J) Representative images and quantification of RIP assay using anti-ZEB1 antibody to validate the indicated binding sites P1 (I) and P4 (J) after mutation. (K) qRT-PCR analysis showed that the expression of circNIPBL after deleting the binding sites in flanking introns. (L, M) Representative images and quantification of Wound healing (L) and Transwell migration and Matrigel invasion (M) assays in indicated UM-UC-3 cells. Scale bar = 100 μm. (N, O) Quantification of the luminescence (N) and metastasis forci (O) in tail-vein injection model. (P) The ratio of lung metastasis was calculated for all groups (n = 12 per group). (Q) The survival time of the ZEB1-transduced tumor bearing mice. The statistical difference was assessed through the nonparametric Mann–Whitney U test in B, Q and the χ2 test in C, P; and one-way ANOVA followed by Dunnett tests in H, K, L, M, N and O; and the two-tailed Student t test in E, I and J. Error bars show the SD from three independent experiments. *p < 0.05 and **p < 0.01

