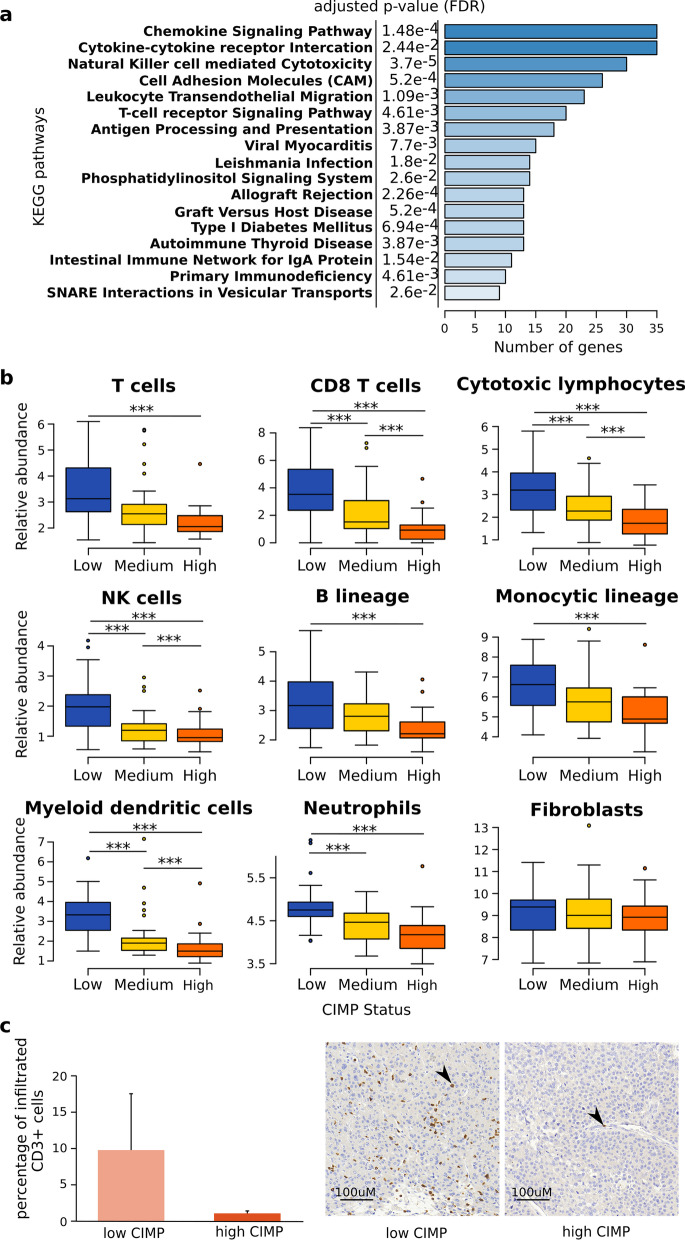
Fig. 3.
hCIMP ACC tumors are characterized by lower abundance of tumor-infiltrating immune cells. a Pathway enrichment analysis on genes repressed by DNA methylation in hCIMP tumors from TCGA dataset. The complete KEGG pathways database was used for the analysis and only the significantly enriched pathways are depicted on the figure. b Relative abundance of tumor-infiltrating immune and non-immune stromal cell populations computed using MCP-counter [19] in lCIMP (n = 32), iCIMP (n = 26), and hCIMP (n = 21) samples from TCGA dataset. Comparison of the relative abundances of each population using the Kruskal–Wallis test followed by Dunn's test with Benjamini–Hochberg corrections. ***p < 0.001. c Left: quantification of the percentage of tumor-infiltrating CD3 + T cells. Data represent the means from at least six independent experiments ± SEM. p value of the Mann–Whitney U Test: p = 0.12. Right: representative screenshot of a highly infiltrated lCIMP sample and a lowly infiltrated hCIMP sample

