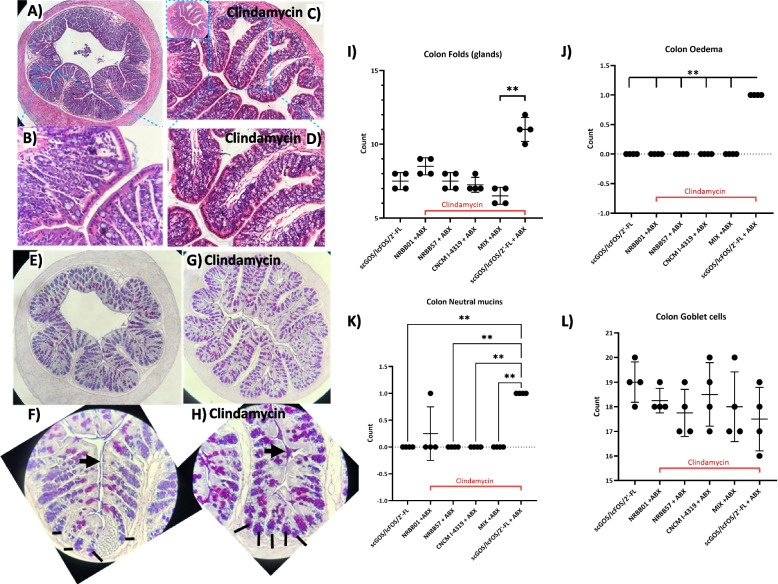
Fig. 7.
Clindamycin induced intestinal changes remain in mice 14 days after cessation (day 29). A–D Changes in histopathological appearance by H&E staining are evident in prebiotic diet only groups without (A, B) and with clindamycin treatment (C, D) with increased colonic glands and oedema at crypt and colonic fold base. E–H Alcian Blue/PAS staining of neutral (pink-red), acidic (blue), mixed (purple) mucins reveal increased staining of neutral mucins following antibiotic treatment (G, H) throughout the colon. This is evident from the crypt to fold tip (apex), see arrows highlighting mucus staining and lines illustrating the colonic crypt (F, H). Histological scoring of the I colonic folds number (glands), J oedema, K neutral mucin staining, L and goblets cells were measured with at least 5 per mouse compared to the prebiotic diet only group. Data are expressed as means ± SD. n = 4 per group. Mean values were significantly different between the groups: ****P < 0.0001

