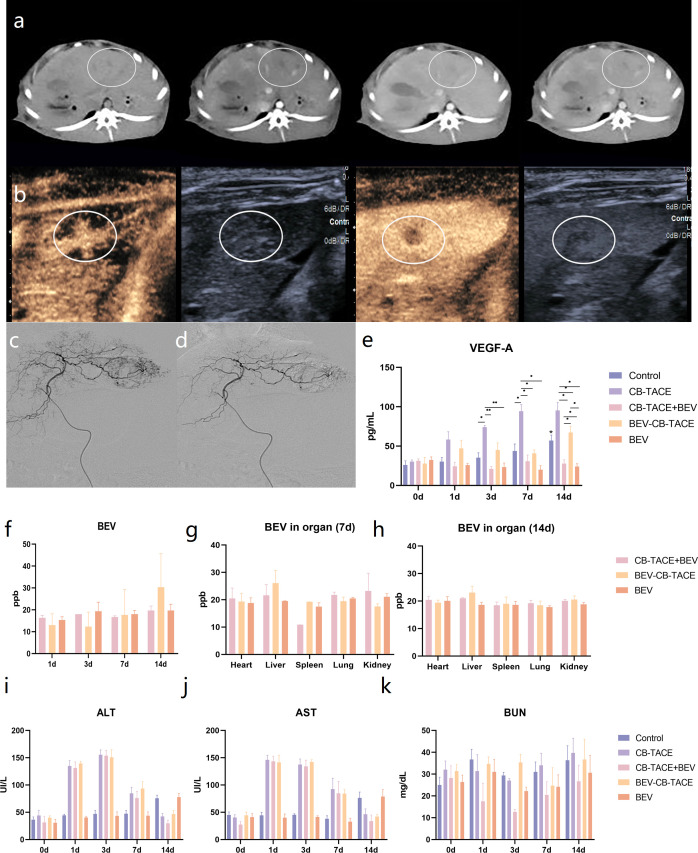
Figure 3.
Rabbit liver VX2 tumor model evaluation and treatment. (A) CT scan and three-phase enhancement could observe low-density lesion in the left part of the liver. (B) Contrast-enhanced ultrasound suggested the obvious phenomenon of “fast in and fast out”. (C) Hepatic arteriography revealed that the hypervascular lesion originate from the left hepatic artery. (D) The abnormal vascular disappeared after TACE. (E) Changes of VEGF-A content in serum pre-treatment and post-treatment 1 d, 3 d, 7 d, and 14 d. (F) Changes of BEV content in serum post-treatment 1 d, 3 d, 7 d, and 14 d. (G) The content of BEV in the heart, embolized liver, spleen, lung, and kidney post-treatment 7 d and 14 d. (H-K) Changes of ALT, AST, and BUN content in serum pre-treatment and post-treatment 1 d, 3 d, 7 d, and 14 d. (*P < 0.05; **P < 0.01).

