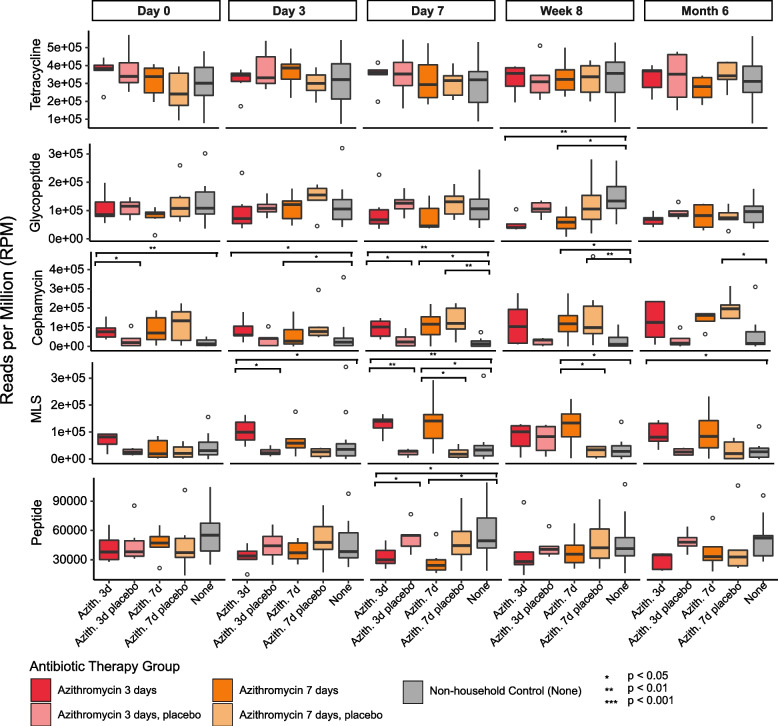
Fig. 4.
Relative abundance of the most dominant ARG drug classes among participants with 7-day azithromycin therapy (Azith 7d) and 3-day amoxicillin therapy (Azith 3d) and their household and non-household controls at each time point sampled. The y-axis represents the relative abundace of the dominant drug classes, and the x-axis represents the therapy they received grouped by the time point sampled. Boxplots are colored by their treatment status (Azith 7d, dark orange; Azith 3d, dark red; Azith 7d household controls, light orange; Azith 3d household controls light red; non-household controls, gray). Abundance calculated via reads per million (RPM) metric. *denotes significance based on Kruskal–Wallis tests with correction via the Holm method

