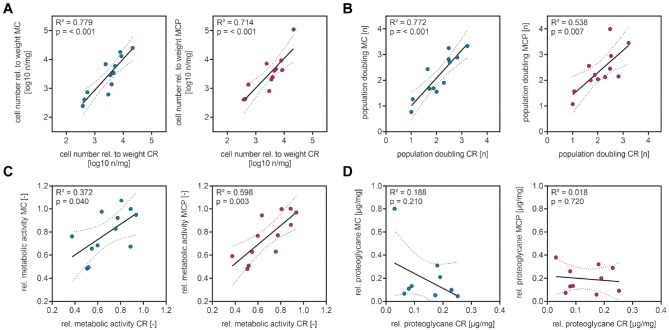
Figure 5.
Correlation analyses indicate a donor-dependent correlation of cell outgrowth, proliferation capacity, and viability of cells from specimens obtained by the different intraoperative harvesting methods. (A) Cell outgrowth in the MC and MCP groups correlates with cell outgrowth in the CR group. Plotted is the decadic logarithm of cell numbers after primary isolation. (B) The proliferation capacity of chondrocytes in the MC and MCP groups correlates with the proliferation capacity of chondrocytes in the CR group. Plotted is the population doubling on day 8 after seeding. (C) The cell viability in the MC and MCP groups correlates with the cell viability in the CR group. Plotted is the metabolic activity on day 8 after seeding. (D) The proteoglycan content of chondrogenic spheroids in the MC and MCP groups does not correlate with the cell viability in the CR group. Plotted is the proteoglycan content of the spheroids relative to the protein content of the spheroids. Data are shown as Pearson correlation coefficient and 95% CI (dashed lines) (linear regression). R 2 , coefficient of determination. CR, curettage; MC, minced cartilage; MCP, minced cartilage with autologous PRP; rel., relative.

