
Figure 2.
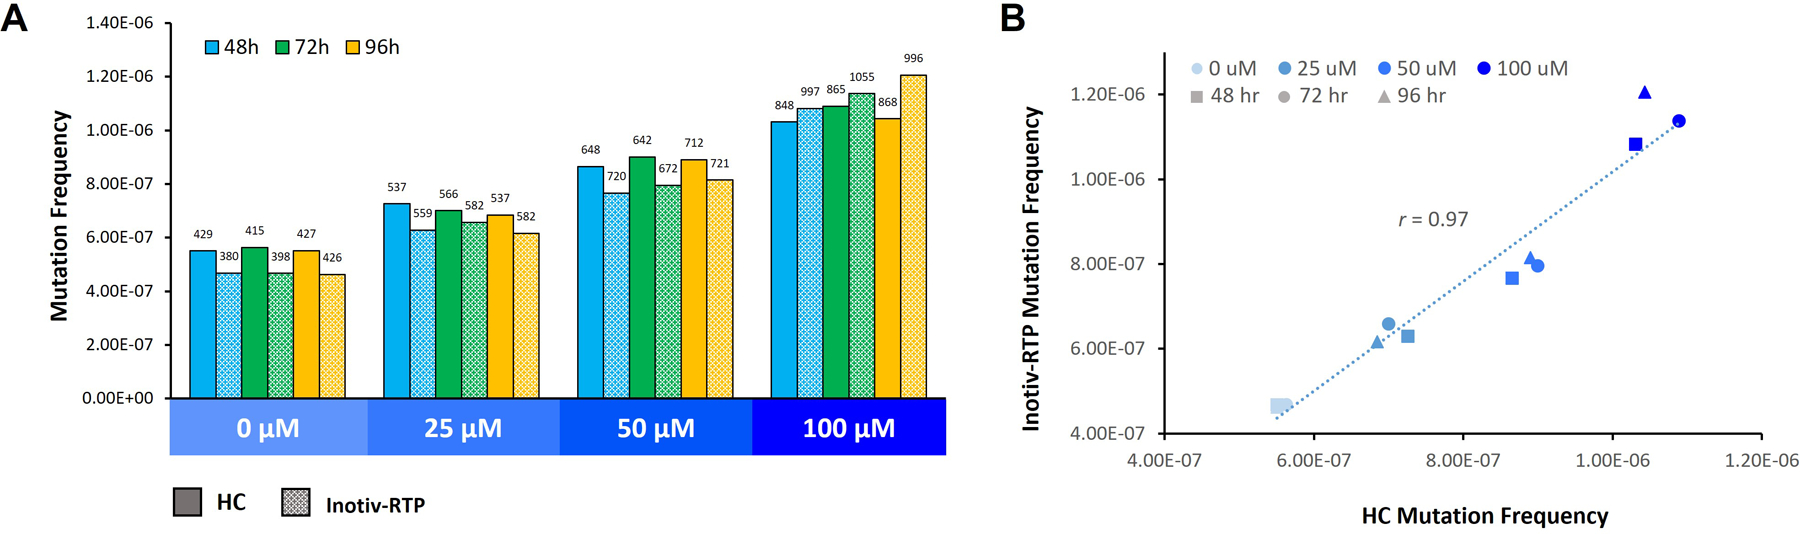
A. Mutation frequency in TK6 cells exposed to ENU measured by Duplex Sequencing (TwinStrand Biosciences). B. Linear correlation of mutation frequency measured at HC and Inotiv-RTP. Cells were sampled after 48, 72, and 96 h following the initial exposure (n=2/ concentration and time point). Library construction and sequencing were completed by TwinStrand. Numbers above the bars represent non-normalized mutation counts. Frequency was determined by dividing the counts by the total number of BP sequenced. There was a significant concentration main effect (Holm-Sidak adjusted p-value < 0.0001) and concentration by lab interaction (Holm-Sidak adjusted p-value < 0.0001). There was no statistically significant difference in mutation frequency across the three time points.