
Figure 5.
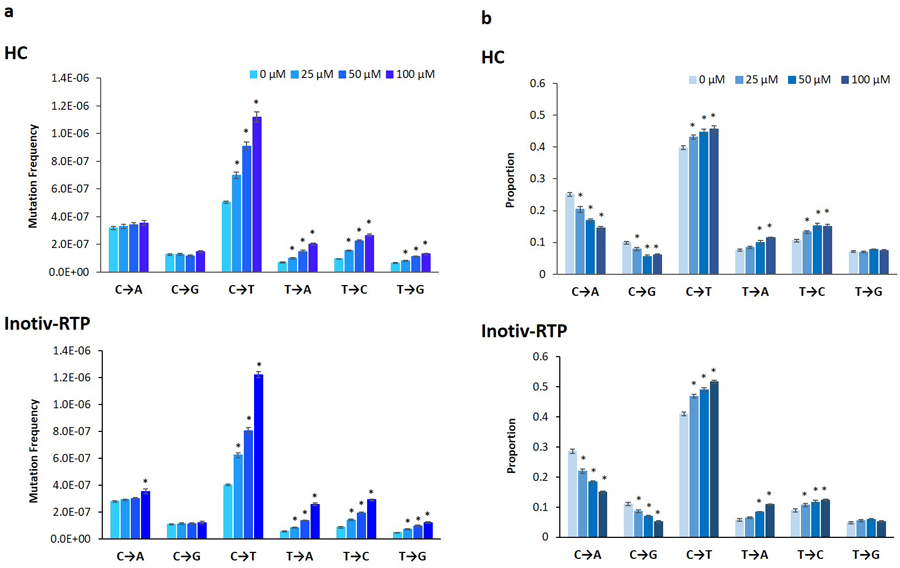
Frequencies (A) and proportions (B) of individual base substitution types in TK6 cells exposed to ENU at HC and Inotiv-RTP measured by Duplex Sequencing (TwinStrand Biosciences). Cells were sampled 48, 72, and 96 h following the initial exposure (n=2). The mutation proportions and frequency at the three time points were averaged (n=6 in total). The error bars represent standard error and asterisk (*) indicates statistical significance (p-value <0.05) in ANOVA with post-hoc Dunnett’s test.