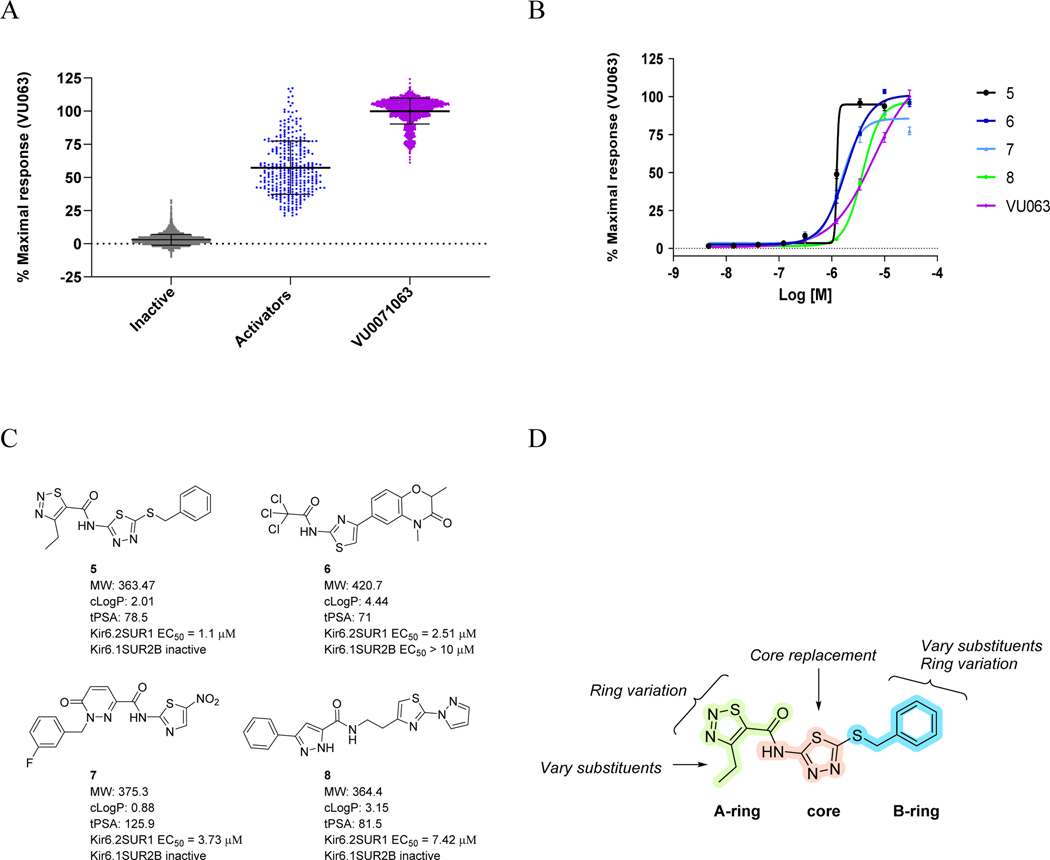
Figure 2.
Summary of HTS screening results and hit to lead optimization strategy (A) Summary of Primary Screening results revealed small molecules that increase the measurement of thallium flux in cells containing Kir6.2SUR1 channels. Hits were identified as Activators when the increase was greater than 3 Standard deviations from the mean plate response (N = 320). Hits selected for retesting in duplicate included the 327 Activators (>3 SD in blue) and 249 weaker activators (B-score > 5). Retest positives remaining after the duplicated testing included 513 of the 576 tested. Comparison to Counter screening reduced these to 494 promoting to candidates for Concentration Response Curve studies (Omit 63 retest negatives or 19 actives in comparison to Kir6.1SUR2B or HEK). Values are displayed normalized to the plate control VU0071063 (positive control in purple n = 32 per plate). Total tested small molecules were 20480. Not shown (B-score Activators (1254), B-score Inhibitors (272). (B) Concentration Response Curve of selected Compounds 5-8. Triplicate values of 9 concentrations ranging 5 nM-30 μM*, plots using GraphPad Prism 9.2 *30 μM omitted on 5. (C) Structures of selected HTS hits 5 – 8. (D) Compound Optimization Strategy.

