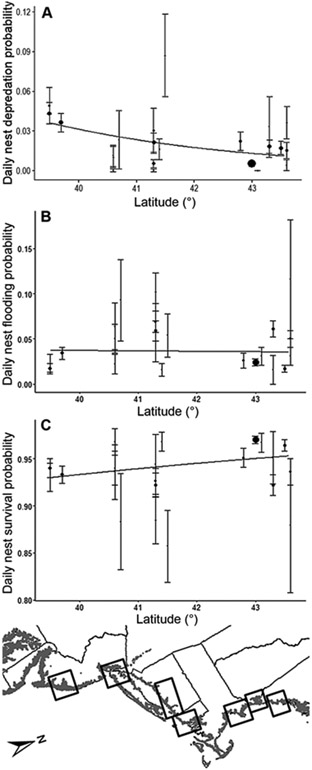
FIGURE 3.
Daily nest failure and survival probabilities modeled as functions of latitude (lines) and study plot (demonstrates maximum local variance, akin to observed values; dot size is proportional to the sample size [number of nests] at each study plot; bar length is proportional to 1 SE), with date held constant (mean serial date = 188). (A) Nest depredation probability decreased with increasing latitude. (B) Daily nest flooding probability was not related to latitude. (C) Total daily nest survival probability increased slightly with increasing latitude.

