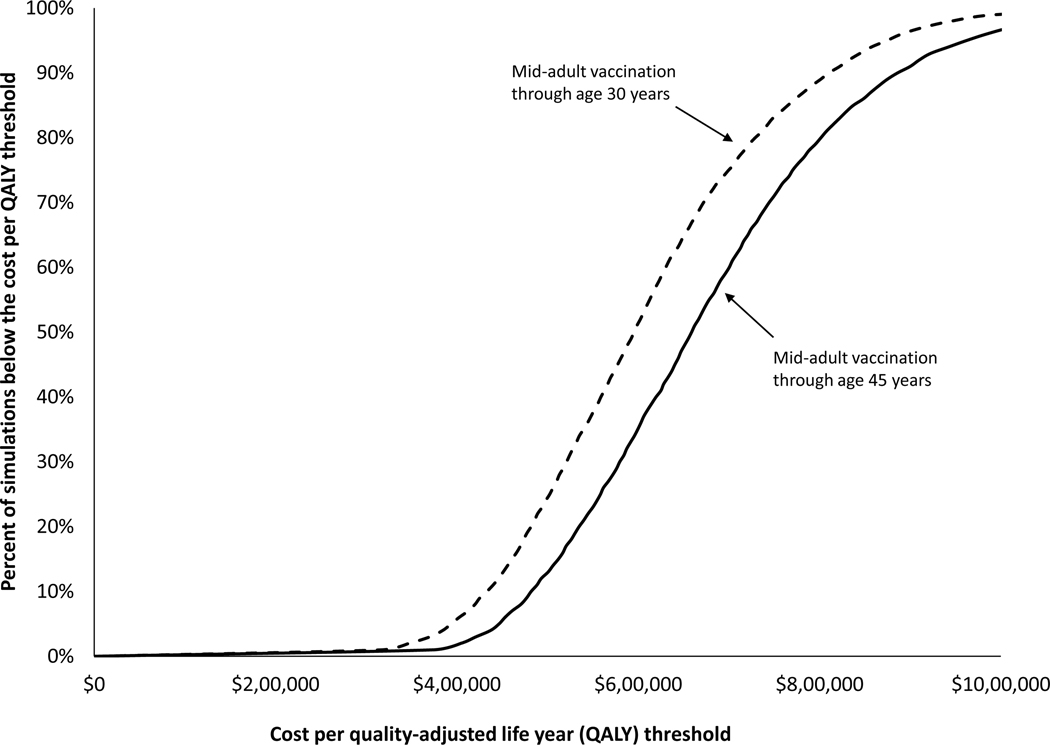
Figure 2 :
Cost-effectiveness acceptability curves: percentage of the simulations in which the incremental cost per QALY gained by mid-adult vaccination was at or below a given cost per QALY threshold. Results are shown for two mid-adult vaccination strategies: vaccination of females and males aged 12–30 years (dotted line) and aged 12–45 years (solid line), vs. the comparison strategy (vaccination of females aged 12–26 years, and males aged 12–21 years).

