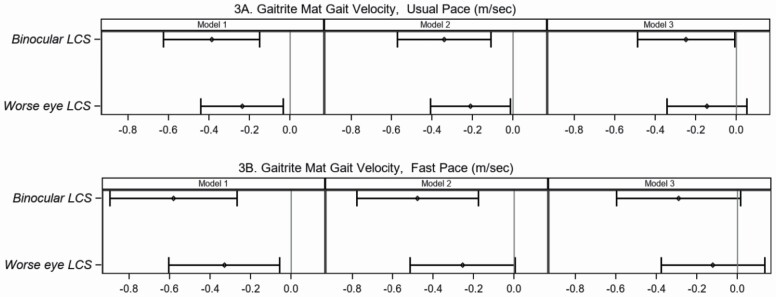
Figure 3.
Association between binocular or worse eye log contrast sensitivity and gait velocity under usual pace or fast pace conditions. Association between binocular or worse eye log contrast sensitivity and GAITRite mat gait velocity (m/s) at (A) usual pace or (B) fast pace. Left Panel—Model 1 is unadjusted bivariate analysis between binocular or worse eye log contrast sensitivity and each measure of gait velocity. Middle Panel—Model 2 is multivariable analysis adjusted for sex, body mass index, diabetes mellitus, and hypertension. Right Panel—Model 3 is multivariable analysis adjusted for age (10 years), sex, body mass index, diabetes mellitus, and hypertension. Plots show differences in the Beta coefficient (point estimate with 95% confidence intervals [horizontal lines]) in gait velocity compared for a 1-unit decrease in log contrast sensitivity.

