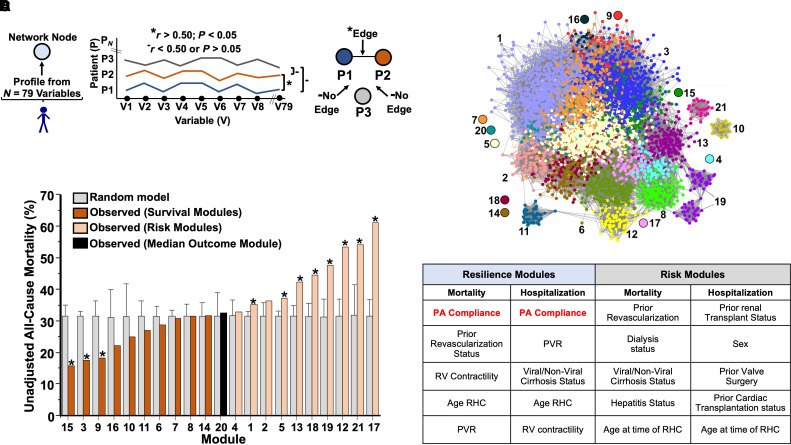
Figure 1.
Network medicine framework identifies PA compliance as a determinant of increased survival in pulmonary hypertension in silico. (A) A network was constructed in which each node (circle) represents one patient, defined by using N = 79 clinical variables, and each edge (known as a link or edge) represents patients who are similar to one another on the basis of their 79-variable clinical profile. To determine which patients were connected by an edge in the network, we performed a Pearson correlation between patients’ clinical profiles. If two patients’ correlation is larger than 0.5, we connect the patients with an edge. Otherwise, there is no edge between the two patients. Asterisks represent the criterion for having an edge. Solid dashes represent the criterion for not having an edge. (B) To stratify the patients into subgroups, a modularity optimization approach was used, resulting in 21 distinct network modules, which represent patient subgroups. (C) All-cause mortality in each module and the corresponding randomized module. The error bars represent the standard deviation of mortality in 1000 randomized modules. The modules that have a significantly different mortality compared to the randomized modules are marked with an asterisk. (D) A random forest-based variable selection method was adopted to rank variable importance for each module. A rank aggregation method was used to aggregate the variable rankings of the top 10 modules with highest survival and the variable rankings of the bottom 10 modules with highest mortalities (risk modules). PA = pulmonary arterial; PVR = pulmonary vascular resistance; RHC = right heart catheterization; RV = right ventricle; V = variable.

