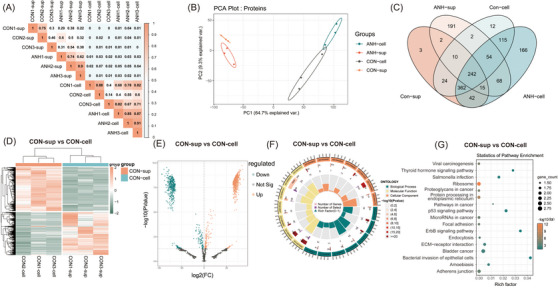
FIGURE 2.

Target analysis of differentially expressed proteins between sEVs and cells in normal fetal groups. (A) Corrplot correlation analysis of within‐group identity and between‐group difference of samples confirmed by MS analysis. (B) Principal component analysis (PCA) of proteins that separated the four groups: CON‐sup, ANH‐sup, CON‐cell, and ANH‐cell. (C) Venn diagram of proteins differentially expressed between the four groups. A total of 1308 proteins were identified. Among these, 242 (18.5%) proteins were present in all samples. (D) Heatmap of proteins differentially expressed between CON‐sup and CON‐cell. 1128 proteins were found to be differentially expressed in sEVs versus cells, including 636 upregulated and 492 downregulated proteins. E) Volcano plots of statistical analysis of all proteins identified in CON‐sup and CON‐cell. F) GO analysis of proteins differentially present in CON‐sup versus CON‐cell through circus plot. (Presenting the main 6 of Biological Process, Cellular Component and Molecular Function, respectively.) G) Bubble plot showing the numbers of DEG‐targeted proteins in each KEGG pathway (targeted genes > 10). CON‐sup, normal fetal amniotic fluid sEVs; ANH‐sup, ANH amniotic fluid sEVs; CON‐cell, normal fetal amniotic fluid cells; ANH‐cell, ANH amniotic fluid cells.
