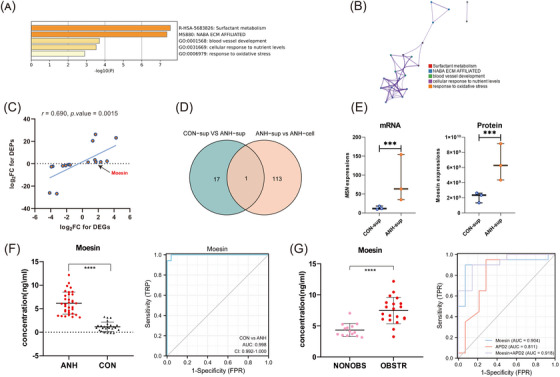
FIGURE 4.

Identification and verification of Moesin as an effective biomarker for ANH diagnosis. (A) Bar chart of clustered enrichment ontology categories (GO and KEGG terms) analysis by Metascape of 18 candidate genes. (B) PPI analysis of 18 candidate genes. Each term is represented by a circle node, the size of which is proportional to the number of input genes that fall under that term, and the color of which represents the cluster identity (i.e., nodes of the same color belong to the same cluster). An edge connects terms with a similarity score greater than 0.3 (the thickness of the edge represents the similarity score). (C) Scatter plot of the pearson correlation between mRNA and protein expression FC ratios from 18 candidate genes. (D) Venn plot for the candidate Moesin that specifically enriched in ANH‐sup by intersecting two groups (CON‐sup vs. ANH‐sup and ANH‐sup vs. ANH‐cell). (E) Significant up‐regulated Moesin expression level in ANH of sEVs. (F) High‐expressed Moesin and ROC curve analysis in fetuses with ANHs compared with normal fetuses (34 ANH vs. 25 normal cases). (G) High‐expressed Moesin and ROC curve analysis in OBSTR groups compared with NONOBS groups (20 OBSTR vs. 14 NONOBS cases). Significant (***p < 0.001, ****p < 0.0001); CON‐sup, normal fetal amniotic fluid sEVs; ANH‐sup, ANH amniotic fluid sEVs; CON‐cell, normal fetal amniotic fluid cells; ANH‐cell, ANH amniotic fluid cells; AUC, area under the curve; ROC, receiver operating characteristic; CON, normal fetuses; OBSTR, postnatal obstructive; NONOBS, postnatal nonobstructive.
