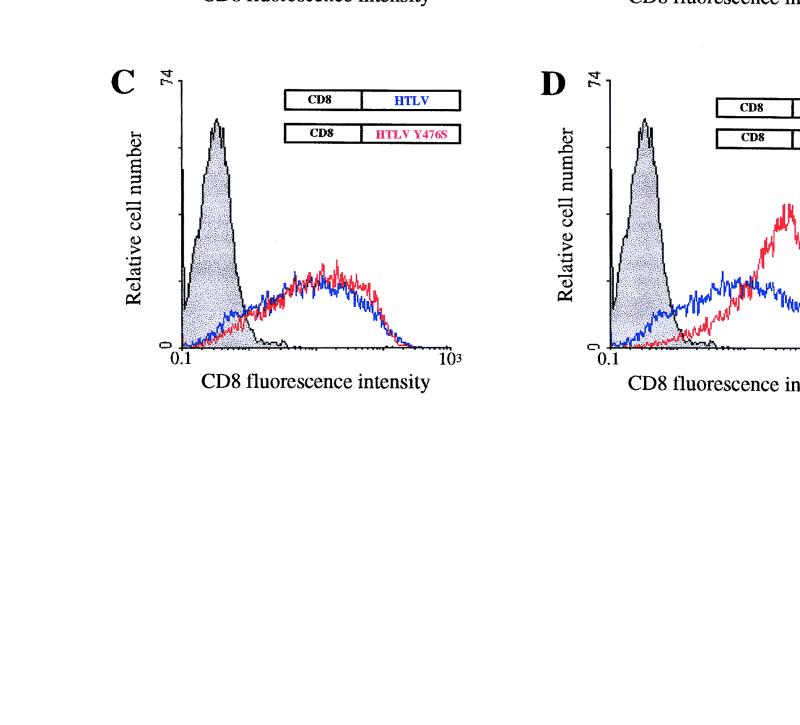
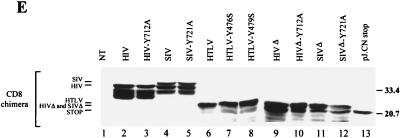
FIG. 2.
Cell surface expression of CD8-TM-CD chimeras in HeLa cells. (A to D) HeLa cells were cotransfected by electroporation with 10 μg of the pCD8-HIV (A), pCD8-SIV (B), or pCD8-HTLV (C and D) (blue curves) or 10 μg of the pCD8-HIV-Y712A (A), pCD8-SIV-Y721A (B), pCD8-HTLV-Y476S (C), or pCD8-HTLV-Y479S (D) vector (red curves) along with 4 μg of pRSV-GFP vector. Surface expression of CD8 hybrids in GFP+ cells was analyzed by flow cytometry 48 h later. Grey curves, cells transfected with the pRSV-GFP vector alone, as the negative control; black curve, cells transfected with the pJ.CNstop vector, as the positive control (A). Data are representative of three independent experiments. (E) CD8-TM-CD chimera expression in HeLa cells. Cells were transfected with 10 μg of pCD8-HIV (lane 2), pCD8-HIV-Y712A (lane 3), pCD8-SIV (lane 4), pCD8-SIV-Y721A (lane 5), pCD8-HTLV (lane 6), pCD8-HTLV-Y476S (lane 7), pCD8-HTLV-Y479S (lane 8), pCD8-HIVΔ (lane 9), pCD8-HIVΔ-Y712A (lane 10), pCD8-SIVΔ (lane 11), pCD8-SIVΔ-Y721A (lane 12), and pJ.CN stop (lane 13) vectors. Identical quantities of lysates from transfected HeLa cells were analyzed by Western blotting with anti-CD8 antibody H-160 (Santa Cruz Biotechnology). NT, nontransfected control cells. Sizes are indicated in kilodaltons on the right.


