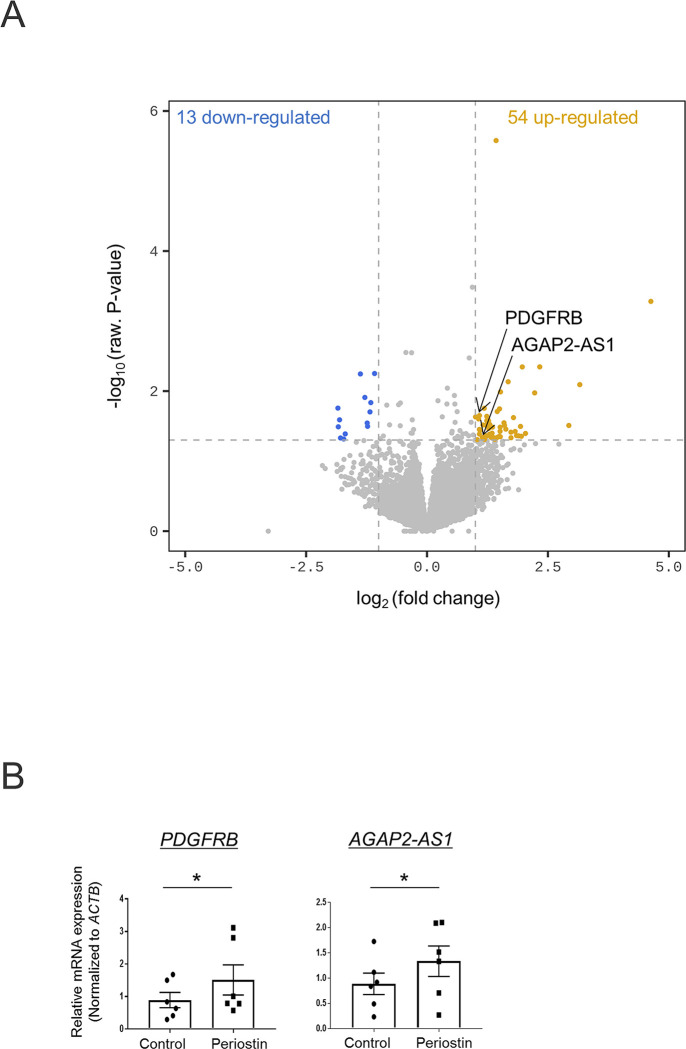
Fig 4. Transcriptional response in periostin-stimulated monocytes.
(A) Volcano plot indicating differentially expressed genes between periostin-stimulated and control monocytes with a threshold of P < 0.05 and fold-change > 2.0. (yellow = increased, blue = decreased). (B) The relative gene expression levels of PDGFRB and AGAP2-AS1 in monocytes were determined by quantitative real-time polymerase chain reaction. Data are shown as the mean ± standard error of the mean (SEM). Statistical analysis was performed using the Wilcoxon rank-sum test *P < 0.05, n = 3.

