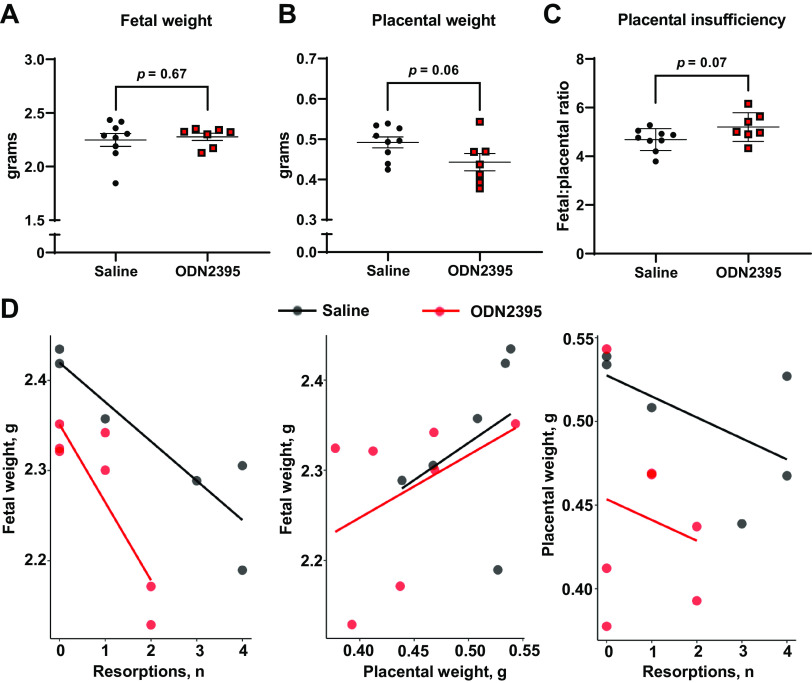
Figure 4.
Effects of ODN2395 on fetal and placental biometrics and fetoplacental dynamics on gestational day 20. Individual and mean fetal weights (A; g) per litter, placental weights (B; g) per litter, fetal to placental weight ratio per litter (C), and scatterplots representing correlations of average fetal weight (D; g) with number of resorptions (left), average fetal weight (g) with average placental weight (g, middle), and average placental weight (g) with number of resorptions (right). Each dot represents the average from a single litter (n = 7–9/group). A–C: values are presented as means ± SD, unpaired t test. D: trend lines (saline = black, ODN2395 = red) represent the linear relationships within the data determined by multiple linear regression. ODN, oligodeoxynucleotides.

